
We closed the SPSC position on September 15, 2021. A copy of the associated Position Update report is here.
We closed the IBP position on April 1, 2020. A copy of the associated Position Update report is here.
Check out this week’s Danger Zone interview with Chuck Jaffe of Money Life.
A rising tide lifts all boats. When the economy grows rapidly, as it has over the past year, even poorly run companies can see a boost in their fundamentals.
These two previous Danger Zone picks both fell over 30% before improving macro-economic conditions bailed them out and led to big increases in their stock prices. However, the fundamental flaws we originally identified remain in place, and these businesses will be extremely vulnerable when economic conditions worsen. SPS Commerce (SPSC: $50/share) and Installed Building Products (IBP: $56/share) are in the Danger Zone.
SPS Commerce (SPSC)
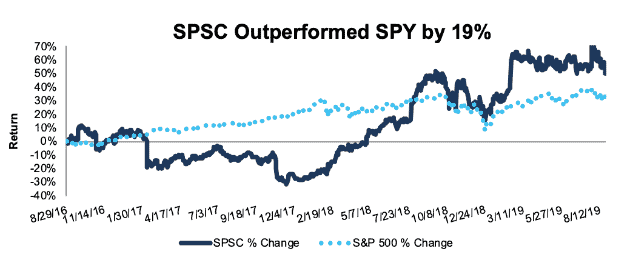
We first made SPS Commerce (SPSC) a Danger Zone pick on August 29, 2016. As Figure 1 shows, the stock fell steadily until the end of 2017, but it has since rebounded, and is now up 50% vs. the S&P 500 up 31%.
Figure 1: SPSC Performance Vs. S&P 500
Sources: New Constructs, LLC and company filings
The increase in the stock price appears to be driven by rising profitability. SPSC’s return on invested capital (ROIC) improved from 4% in 2016 to 15% TTM. Accounting earnings have seen a similar rebound, with GAAP net income improving from $6 million in 2016 to $29 million TTM. Despite this recent increase in profitability, we don’t think SPSC’s core business model is any more sustainable than in the past.
Cutting Back on Marketing Fuels Profit Growth. SPSC has improved profitability by significantly cutting back on sales and marketing expense. Sales and marketing declined from 50% of revenue in 2017 to just 42% TTM. In the most recent quarter, SPSC cut its sales and marketing expense to just 26% of revenue.
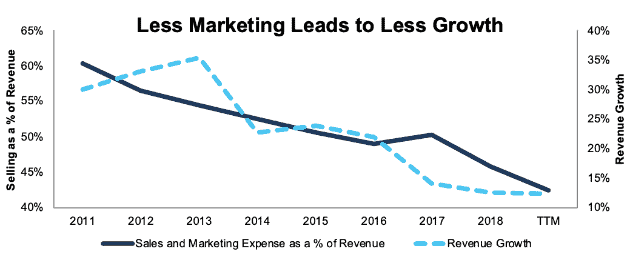
As Figure 2 shows, SPSC’s cuts to sales and marketing expenses have led to similar declines in revenue growth. In 2011, SPSC spent 60% of revenue on sales and marketing and grew revenue by 30%. Over the trailing twelve months, SPSC spent 42% of revenue on sales and marketing and grown revenue by just 12% year over year.
Figure 2: SPSC Sales and Marketing as a % of Revenue vs. Revenue Growth Since 2011
Sources: New Constructs, LLC and company filings
Even the 12% TTM revenue growth rate is inflated by the impact of acquisitions of smaller competitors CovalentWorks and EDIAdmin. SPSC’s organic growth is in the single digits, which is below the 11% growth rate for the Electronic Data Interchange (EDI) industry as a whole.
There’s no sign that SPSC has built any sort of sustainable competitive advantage in its industry, and review sites tend to rank SPSC behind key competitors like TrueCommerce. In addition, SPSC has a churn rate of 12-13%, so if the company keeps cutting sales and marketing costs, it could start losing customers.
A strong economy and a rapidly-growing industry have allowed SPSC to cut its marketing expenses while still growing revenue, which drove a short period of high profitability. However, we don’t see any reason to believe the company’s business model can sustain this higher profitability.
Valuation Implies Unrealistic Expectations. SPSC can’t cut marketing costs and achieve profit growth at the rate required to justify its valuation. Our reverse DCF model shows the high expectations implied by SPSC’s stock price.
In order to justify its current valuation of $50/share, SPSC must achieve after-tax profit (NOPAT) margins of 12%, up from 10% TTM, and grow revenue by 20% compounded annually for nine years. See the math behind this dynamic DCF scenario.
It’s hard to see how SPSC can continue to cut sales and marketing costs to expand its margins while simultaneously accelerating its revenue growth rate. It’s not as if SPSC has other levers for margin expansion, either. The company’s gross margin actually declined from 67% in Q2 2018 to 65% in Q2 2019.
Even with the recent profit growth, SPSC is still a company with an overvalued stock price, slowing growth, and no clear competitive advantage.
Installed Building Products (IBP)
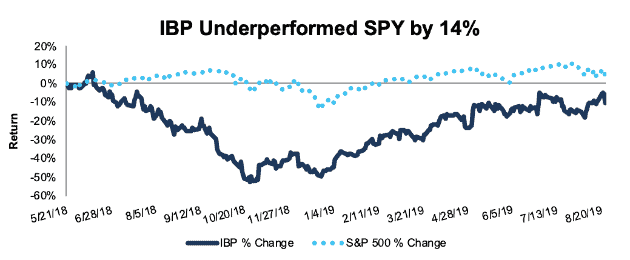
We first made Installed Building Products (IBP) a Danger Zone pick on May 21, 2018. From the publication of the report to the end of 2018, the stock fell over 45%, and was one of our best Danger Zone picks for the year. However, as Figure 3 shows, IBP has rebounded in 2019 and is now down just 10% since the publication of our article vs. the S&P 500 up 4%.
Figure 3: IBP Performance Vs. S&P 500
Sources: New Constructs, LLC and company filings
The recovery in IBP’s stock price is fueled by beats in each of its past three earnings reports. Each of these beats led to ~10% increase in the stock price.
IBP, which derives over 80% of its revenue from residential construction, is benefiting from a housing market that has been more durable than expected. Despite constant predictions of a downturn, residential housing starts grew 1% year-over-year in July.
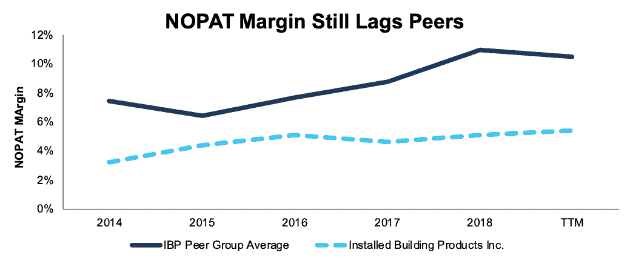
Margins Still Lag Industry Peers. The growth in the housing market is especially good for residential construction supply companies like IBP. Since 2017, IBP’s NOPAT margin has improved from 4.6% to 5.4% TTM. However, as Figure 4 shows, its peers[1] in the industry have improved their margins from 8.7% to 10.5% over the same time.
Figure 4: IBP NOPAT Margin vs. Peers: 2014-TTM
Sources: New Constructs, LLC and company filings
Far from improving its position in the industry, IBP’s margins have fallen even farther behind its peers.
Still a Broken Roll-Up Scheme. IBP continues to rely heavily on acquisitions to grow its business. The company completed 10 acquisitions in 2018, and it has completed four acquisitions through the first six months of 2019. The company recently announced another significant acquisition on August 19.
These acquisitions have caused IBP’s invested capital to increase by 12% over the trailing twelve months, roughly the same rate as its revenue growth. As a result, the company’s invested capital turns, a measure of balance sheet efficiency, remain flat at 2.1. These acquisitions also contribute to IBP’s -$4 million free cash flow.
Positive industry tailwinds may be boosting margins, but IBP’s capital efficiency hasn’t improved, and it continues to burn through cash. What’s worse, the poor corporate governance that led to this value-destroying acquisition strategy remains in place. IBP continues to tie executive compensation to Adjusted EBITDA and highlight the metric in its press releases. As we’ve covered before, Adjusted EBITDA is a highly flawed metric that excludes real operating expenses and incentivizes executives to pursue overpriced acquisitions to the detriment of shareholder value.
A review of IBP’s peers show that almost all of them have also carried out value-destroying acquisitions and have flat or declining capital turns as well – the only exception being recent Long Idea Builders FirstSource (BLDR). Poor corporate governance and capital allocation seem to be the norm for this industry. However, IBP’s poorer margins and pricier valuation make it especially dangerous.
Valuation Remains Irrational. Despite its inferior margins, IBP is significantly more expensive than its peers. IBP has a price to economic book value (PEBV) of 3.3, while its peer group average is 1.8.
In order to justify its valuation of $56/share, IBP must expand its NOPAT margin to 6% (up from 5% TTM) and grow NOPAT by 11% compounded annually for 14 years. See the math behind this dynamic DCF scenario. This scenario assumes IBP will be able to achieve an ROIC of 17%, above its 11% TTM ROIC.
This expectation seems optimistic for a company that lags its peers in a highly cyclical industry. It assumes that IBP can continue to grow through its current strategy of acquisitions, but we think, in a bear market, IBP will struggle to find lenders willing to finance its consistent cash burn.
In a more realistic scenario, where margins stay flat and NOPAT grows by 6% compounded annually for 10 years, the stock is worth $27/share, a 54% downside to the current stock price. See the math behind this dynamic DCF scenario.
IBP has been propped up by a resilient housing market and industry-wide margin improvement, but it still faces significant risks if economic conditions worsen. The company’s acquisition-heavy strategy has led to Goodwill and other intangibles accounting for 36% of its total assets. This high balance of intangible assets leads to significant risk of a write-down that could be a catalyst to send shares lower.
This article originally published on August 26, 2019.
Disclosure: David Trainer, Kyle Guske II, and Sam McBride receive no compensation to write about any specific stock, style, or theme.
Follow us on Twitter, Facebook, LinkedIn, and StockTwits for real-time alerts on all our research.
[1] Peer group consists of American Woodmark (AMWD), Builders FirstSource (BLDR), Gibraltar Industries (ROCK), TopBuild (BLD), and Trex Co (TREX).