We closed this position on November 18, 2020. A copy of the associated Position Update report is here.
Market narratives often persist in the face of contradicting data (for instance, the “Retail Apocalypse”). Doing your diligence helps maintain the objectivity needed to see when a narrative is wrong and if there is value in a particular sector or stock.
This firm has been steadily growing profits, is more efficient than its peers, and should benefit from a structural shift in the way it customers do business. However, overblown fears of a housing crash have the stock priced as if profits will be nearly cut in half. Builders FirstSource (BLDR: $16/share) is this week’s Long Idea.
Long-Term Track Record of Profit Growth
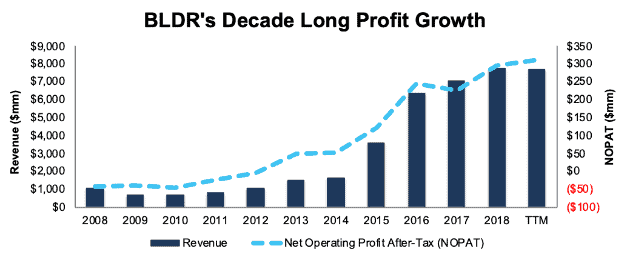
Investors who focus solely on headlines may be surprised to learn that BLDR has consistently grown profits, both in the years after the housing crash and recently. Since 2015, BLDR has grown after-tax operating profit (NOPAT) by 35% compounded annually. Trailing twelve month (TTM) NOPAT of $310 million is up 26% year-over-year. Long-term, BLDR has grown NOPAT by 32% compounded annually since 2007.
Figure 1: BLDR’s Revenue & NOPAT Since 2008
Sources: New Constructs, LLC and company filings
Leveraging Leading Market Share and A More Efficient Business
BLDR has managed to achieve a level of scale and market share that is rare in the highly fragmented professional building materials industry. Through its strategic acquisition of ProBuild in 2015, which more than doubled the firm’s revenue, Builders FirstSource became the largest supplier of structural building products for new residential construction and repair and remodeling in the United States.
In the 2018 ProSales 100, which ranks all professional building suppliers, regardless of product type, by sales, BLDR ranked second, with a 13% market share. The top firm is ABC Supply, a roofing and siding manufacturer, and not a competitor of BLDR. Its closest competitors, BMC Stock Holdings and 84 Lumber each earned a 6% share of the overall professional building suppliers market.
BLDR leverages its large geographical footprint (operations in 39 states) to provide superior service for homebuilders across the country with minimal product delivery time and fast on-site service. BLDR also runs a more efficient and profitable business than its peers. Investments in operational initiatives, such as dispatch and delivery optimization systems, back office automation, and dynamic pricing tools drive superior balance sheet efficiency.
Figure 2 shows that Builders FirstSource’s invested capital turns – annual revenue divided by average invested capital – are higher and rising faster than peers’ in each of the past four years and the TTM period. Peers in the analysis are taken from BLDR's 2018 Proxy Statement and include Beacon Roofing Supply (BECN), Masco Corporation (MAS), Boise Cascade Company (BCC), and more.
Investors that do not analyze balance sheets will miss BLDR’s superior capital turns and the cash they generate.
Figure 2: Superior Balance Sheet Efficiency Vs. Peers

Sources: New Constructs, LLC and company filings
Per Figure 3, BLDR has also improved its return on invested capital (ROIC) at a faster rate and maintains a higher ROIC than its peers.
Figure 3: Superior Profitability Vs. Peers

Sources: New Constructs, LLC and company filings
Housing Market is Much Improved Since Last Crash
BLDR’s exposure to the United States’ housing market draws the common bear argument that the housing market has once again reached bubble levels. Articles proclaiming the imminent crash or popping of the housing bubble are common.
This bear thesis overstates the localized nature of any housing bubble (think Micro-Bubble for houses) and downplays just how radically different the current housing market is when compared to the crash in 2008-2009. While local bubbles may exist, the overall housing market remains strong.
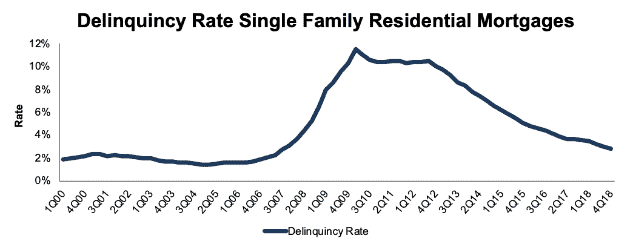
The first difference – consumers are paying their mortgages at much higher rates. Delinquency rates are well below the previous highs reached during the 2008-2009 crash, per Figure 4. The delinquency rate, which stood at 2.83% in 4Q18, is well below the 12% peak of the housing crash. It is also still above the 10-year average prior to the 08-09 housing crash (2.3%), which suggests the delinquency rate could fall even further.
Figure 4: Delinquency Rates Significantly Lower Than Housing Bubble
Sources: Federal Reserve Bank of St. Louis and New Constructs, LLC
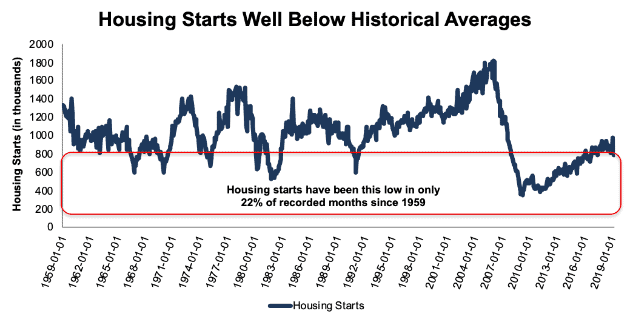
The second difference – housing starts remain well below historical average, and are expected to grow modestly over the next three years. In March 2019, single family housing starts, which include homes that haven’t completed the sale process yet, were 785 thousand. This level is up from 358 thousand at the worst point of the last housing crash, and well below the 1.8 million at the peak before the crash.
Historically, single family housing starts averaged 1.1 million per year in the 30 year period prior to the 2000’s according to the U.S. Census Bureau data. Since 2000, housing starts have averaged 956 thousand, which is still 22% greater than March 2019 levels. Bears argue new home construction has topped out, yet it still has not reached historical averages, both before or including the most recent housing bubble. In fact, housing starts have only been lower than the current level in only 22% of recorded months dating back to 1959, with most of the times occurring since 2008.
Figure 5: Housing Starts Significantly Lower Than Historical Averages
Sources: U.S. Census Bureau and New Constructs, LLC
The National Association of Home Builders expects single family housing starts to grow anywhere from 1-3% annually through 2021, which runs counter to bears’ concerns of an imminent crash. Even in this conservative scenario, single family housing starts would be 4-16% below historical averages, depending upon which time period used.
Flat Rates Could Further Boost Housing Market
Bears also argue that rising rates will make buyers delay the purchase of a new home, or worse, price buyers out of the housing market altogether. However, mortgage application data, which tracks buyers applying for mortgages, doesn’t support that argument.
In April 2019, mortgage applications to purchase a home reached their highest level since April 2010. If rising rates haven’t stopped buyers in previous months, the latest stance on rates from the Federal Reserve could spur even greater purchasing action. The latest Federal Open Market Committee minutes revealed that most members see interest rates on hold for all of 2019, which reaffirms our thesis that rates will stay low compared to historical levels. A flat rate environment could provide further stability needed to push even more consumers into purchasing a home.
Improving ROIC Correlated with Creating Shareholder Value
Numerous case studies show that getting ROIC right is an important part of making smart investments.This paper compares our analytics on a mega cap company to other major providers. The Appendix details exactly how we stack up. The technology that enables this research is featured by Harvard Business School.
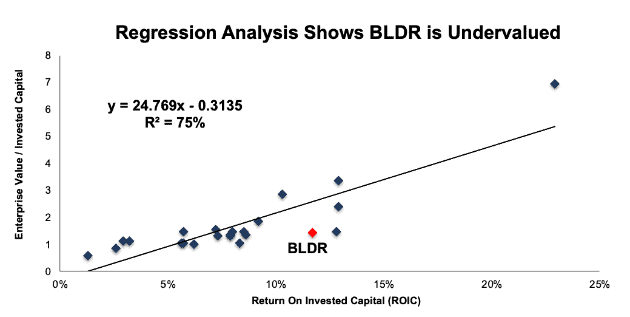
Per Figure 6, ROIC explains 75% of the difference in valuation for the 24 construction supplies & fixtures firms under coverage. BLDR’s stock trades at a discount to peers as shown by its position below the trend line.
Figure 6: ROIC Explains 75% Of Valuation for Construction Supplies & Fixtures Firms
Sources: New Constructs, LLC and company filings
If the stock were to trade at parity with its peer group, it would be worth $42/share – a 156% upside to the current stock price. Given the firm’s rising profits and competitive advantages, one would think the stock would garner a premium valuation. Below we’ll use our reverse discounted cash flow (DCF) model to quantify just how high shares could rise assuming conservative profit growth.
BLDR Is Priced for Permanent Profit Decline
Despite its strong fundamentals, and outperforming stock price (+45% YTD vs. S&P +14%), BLDR looks cheap, even according to traditional valuation metrics. Its P/E ratio of 8 is well below the Consumer Cyclicals sector average of 23 and the overall market average of 22.
While the housing market may be slowing, it is nowhere near as bad as what BLDR’s valuation implies. At its current price of $16/share, BLDR has a price-to-economic book value (PEBV) ratio of 0.6, which means the market expects BLDR’s NOPAT to permanently decline by 40%. This expectation seems rather pessimistic for a company that has grown NOPAT by 35% compounded annually since 2015 and 10% compounded annually since 2005.
If we assume that BLDR can maintain 2018 NOPAT margins of 4% and grow NOPAT just 3% compounded annually over the next decade, the stock is worth $22/share today – a 38% upside. See the math behind this dynamic DCF scenario. This scenario could prove conservative, as BLDR has a proven ability to grow faster than the overall housing market in the past.
Sustainable Competitive Advantage That Will Drive Shareholder Value Creation
Here’s a summary why we think the moat around Builders FirstSource’s business will enable the company to generate higher profits than the current valuation of the stock implies.
- National manufacturing footprint to provide faster deliveries and service
- More efficient operations than peers
- Superior scale in a highly fragmented industry drives pricing power
- Proven relationships with the nation’s largest homebuilders
What Noise Traders Miss with BLDR
These days, fewer investors focus on finding quality capital allocators with shareholder friendly corporate governance. Instead, due to the proliferation of noise traders, the focus tends toward technical trading tends while high-quality fundamental research is overlooked. Here’s a quick summary for noise traders when analyzing BLDR:
- Balance sheet efficiency superiority vs peers (better capital turns)
- Recurring profits (NOPAT) are greater than reported profits
- Strength in the overall housing market that gets overshadowed by smaller market bubbles
- Valuation implies 40% permanent profit decline and gives BLDR significant upside
Structural Shifts in Home Construction Could Boost Shares
While housing prices, starts, and mortgage applications have fluctuated in recent years, the one data point that has not budged is unfilled construction jobs. According to the NAHB, there were 298 thousand unfilled construction jobs in August 2018, a post 2008 recession high. This labor shortage has played a key role in driving up the prices of homes and the expenses of homebuilders.
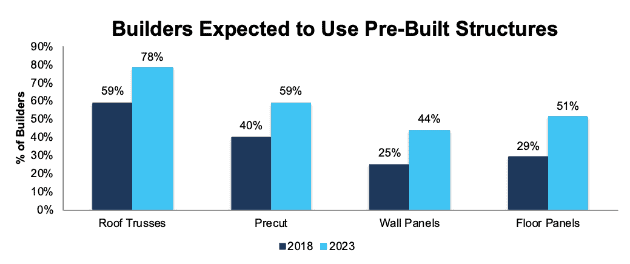
To assist homebuilders amidst the labor shortage, BLDR is expanding production of factory built roof and floor trusses, wall panels, stairs, and more. These products are pre-built and delivered to a construction site ready for installation, which eliminates the need for measuring, cutting, and framing on site. Builders are keenly aware of the benefits of pre-built structures and plan to significantly increase usage of these products in the coming years.
The percent of builders using manufactured roof trusses, precuts, wall panels, and floor panels is expected to increase anywhere from 19-22 percentage points (depending upon product type) from 2018-2023 according to a Home Innovation Research study of 300 U.S. Homebuilders. Details in Figure 7.
Figure 7: The Shift to Using More Pre-Built Structures Is Here
Sources: Home Innovation Research, BLDR 1Q19 Earnings Presentation, and New Constructs, LLC
BLDR estimates these types of products can cut down homebuilder jobsite hours by 60% and use 27% less in board foot of lumber. In 2018, BLDR’s Manufactured Products segment represented 18% of sales. This segment is also higher margin. Management noted in its 1Q19 conference call that it is focused on expanding manufacturing capacity for these products.
Continued adoption of pre-built products helps homebuilders manage labor shortages, should drive BLDR’s margins higher, and provides a runway for future profit growth and stock price appreciation.
Focused on Paying Down Debt, Not Capital Return
Builders FirstSource does not currently pay a dividend on its common stock and doesn’t have a formal stock repurchase plan in place. Instead, the company is focused on paying down debt (currently $1.8 billion compared to $2.1 billion in 2016). In 4Q18, BLDR repurchased $54 million (7% of outstanding notes at time of purchase) in aggregate principal amount of its senior secured notes due 2024. In 1Q19, the company repurchased an additional $20 million (3% of outstanding notes at time of purchase) of the 2024 notes.
Corporate Governance Could be Improved
BLDR ties its executive compensation to a wide variety of performance metrics, including total sales, adjusted EBITDA, working capital as a percentage of sales, and total shareholder return.
We’ve outlined the issues of tying executive compensation to adjusted EBITDA here. While not ideal, BLDR’s exec comp plan has not rewarded executives for destroying shareholder value. Since 2005, BLDR’s economic earnings have grown 12% compounded annually. Economic earnings have grown an impressive 48% compounded annually since 2013.
Regardless, we’d prefer BLDR replace adjusted EBITDA with ROIC in its exec comp plan. Everyone wins when executives are incentivized to maximize ROIC.
Insider Trading and Short Interest Are Minimal
Insider activity has been minimal over the past 12 months, with 543 thousand shares purchased and 681 thousand shares sold for a net effect of 138 thousand shares sold. These sales represent less than 1% of shares outstanding.
There are currently 2.9 million shares sold short, which equates to 3% of shares outstanding and 3.3 days to cover. Short interest has decreased 34% from the end of 2018 and continued profit growth could push the remaining shorts out and send shares higher.
Critical Details Found in Financial Filings by Our Robo-Analyst Technology
As investors focus more on fundamental research, research automation technology is needed to analyze all the critical financial details in financial filings. Below are specifics on the adjustments we make based on Robo-Analyst[1] findings in Builder FirstSource’s 2018 10-K:
Income Statement: we made $154 million of adjustments, with a net effect of removing $90 million in non-operating expense (1% of revenue). We removed $32 million in non-operating income and $122 million in non-operating expenses. You can see all the adjustments made to BLDR’s income statement here.
Balance Sheet: we made $407 million of adjustments to calculate invested capital with a net increase of $318 million. The most notable adjustment was $265 million in off-balance sheet operating leases. This adjustment represented 12% of reported net assets. You can see all the adjustments made to BLDR’s balance sheet here.
Valuation: we made $1.9 billion of adjustments with a net effect of decreasing shareholder value by $1.9 billion. There were no adjustments that increased shareholder value. Apart from $1.8 billion in total debt, which includes the off-balance sheet debt noted above, the largest adjustment to shareholder value was $12 million in outstanding employee stock options. This adjustment represents 1% of BLDR’s market cap. You can see all the adjustments made to BLDR’s valuation here.
Attractive Funds That Hold BLDR
There are no funds that receive our Attractive-or-better rating and allocate significantly to Builders FirstSource.
This article originally published on May 15, 2019.
Disclosure: David Trainer, Kyle Guske II, and Sam McBride receive no compensation to write about any specific stock, style, or theme.
Follow us on Twitter, Facebook, LinkedIn, and StockTwits for real-time alerts on all our research.
[1] Harvard Business School features the powerful impact of our research automation technology in the case New Constructs: Disrupting Fundamental Analysis with Robo-Analysts.
