
We closed this position on April 1, 2020. A copy of the associated Position Update report is here.
Check out this week’s Danger Zone interview with Chuck Jaffe of Money Life.
The high-low fallacy means acquisitions look good as long as the company with the higher P/E buys a lower P/E company – no matter the true economics of the deal. In other words, companies can artificially manufacture EPS growth via acquisitions while cash flows plummet.
This firm is a classic “roll-up” that has been buying up smaller competitors for years to manufacture EPS growth. Its recent and largest acquisition to date is also the most harmful to shareholders. These issues, along with misaligned executive incentives, limited cash reserves to cover its cash burn and an overvalued stock price, land Installed Building Products (IBP: $58/share) in the Danger Zone.
Roll-Up Scheme Destroys Shareholder Value
Installed Building Products has executed a classic roll-up strategy: buy smaller competitors with the stated goal of achieving greater scale in a fragmented market. Since 2015, IBP has acquired over 30 different firms.
In January 2017, IBP acquired Alpha for $117 million, which is its largest acquisition to date. The acquisition of Alpha (and others that year) boosts EPS and continues the roll-up scheme but overlooks prudent capital allocation. IBP grew after-tax operating profit (NOPAT) by 18% in 2017. This profit growth pales in comparison to the 57% increase in invested capital or the 136% increase in long-term debt over the same time. Such poor capital allocation drove IBP’s return on invested capital (ROIC) down from 13% in 2016 to 10% in 2017.
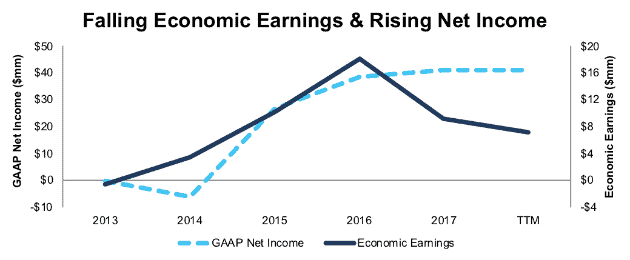
As Figure 1 shows, IBP’s economic earnings, the real cash flows of the business, have fallen from $18 million in 2016 (year before acquisition) to $7 million over the last twelve months (TTM). This decline in economic earnings comes despite GAAP net income rising from $38 million in 2016 to $41 million TTM.
Figure 1: IBP’s True Cash Flows Are in Decline
Sources: New Constructs, LLC and company filings
Cash Burn Cannot Continue Much Longer
Beyond destroying shareholder value, the numerous acquisitions have not led to a more efficient operation. IBP’s NOPAT margin has fallen from 5.1% in 2016 to 4.5% TTM. The poor capital allocation is reflected in IBP’s average invested capital turns, a measure of balance sheet efficiency, which have fallen from 2.5 in 2016 to 2.0 TTM. Falling margins and inefficient capital use have dropped IBP’s ROIC from 13% in 2016 to 9% TTM. Lastly, IBP has burned through $309 million (17% of market cap) in free cash flow over the past four years, or $77 million per year on average. IBP’s cash on the books at the end of 2017 can support this level of cash burn for just over one year.
Non-GAAP Numbers Further Mislead Investors
Due to numerous non-recurring and unusual expenses related to acquisitions, a roll-up strategy can significantly affect reported financials. Companies participating in a roll-up strategy will routinely tout their own non-GAAP metrics as a better representation of the business to distract investors from poor cash flows.
IBP highlights Adjusted EBITDA for investors and uses the metric to determine executive bonuses (more on that later). Adjusted EBITDA is a favorite metric of other roll-up schemes such as Acadia Healthcare (ACHC) and Valeant Pharmaceuticals (VRX), as it lets companies ignore all the capital costs involved in acquisitions and exclude real operating costs such as share-based compensation.
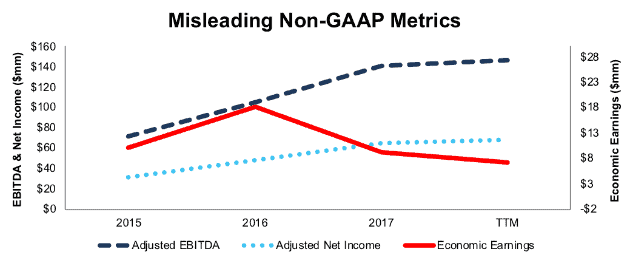
Figure 2 shows that adjusted EBITDA (along with adjusted GAAP net income) provides a misleading picture of IBP’s profitability since the Alpha acquisition. IBP’s adjusted EBITDA increased from $71 million in 2015 to $146 million TTM. When calculating 2017 adjusted EBITDA, IBP removed nearly $7 million (16% of GAAP net income) in share-based compensation expense and $3 million (8% of GAAP net income) in acquisition related expense.
Ultimately, while adjusted EBITDA more than doubled from 2015-TTM, economic earnings, the true cash flows of the business, fell by 30%.
Figure 2: IBP’s Adjusted EBITDA Overstates Profitability
Sources: New Constructs, LLC and company filings
Executive Compensation Plan Incentivizes Further Value Destruction
Installed Building Products’ executive compensation misaligns executives’ interests with shareholders’ interests by tying bonuses to metrics that are not related to long-term value creation. This misalignment helps drive the decline in economic earnings shown in Figures 1 and 2.
IBP uses performance metrics for both cash incentives and long-term equity compensation. Unfortunately for investors, the performance metric used in both cases is adjusted EBITDA. As noted above, adjusted EBITDA removes real costs such as share-based compensation expense and acquisition costs. Despite economic earnings falling, stock awards for the CEO, CFO, and COO more than doubled in 2017.
We’ve demonstrated through numerous case studies that ROIC, not non-GAAP net income or adjusted EBITDA, is the primary driver of shareholder value creation. A recent white paper published by Ernst & Young also validates the importance of ROIC (see here: Getting ROIC Right) and the superiority of our data analytics. Without major changes to this compensation plan (e.g. emphasizing ROIC), investors should expect further value destruction.
ROIC Tells the Real Story: Profitability Is Declining
The insulation installation industry is one of many that makeup home construction, which is largely fragmented on a local level. IBP’s roll-up strategy posits that by acquiring many of these local providers, a larger firm can reap the benefits of scale and operate more efficiently. While in theory this argument may sound compelling, it is not borne out in reality. IPB’s constant acquisitions are not creating a more efficient business.
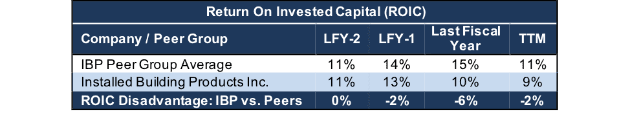
Even in a rapidly growing market, their margins and capital turnover fail to keep pace with peers. In fact, the peer group average ROIC improved seven percentage points from 2013-2016. IBP’s grew less, at six percentage points. Since then as the market has cooled, the peer average continues to best IBP’s results, per Figure 3.
Figure 3: IBP’s ROIC Lags Peer Group
Sources: New Constructs, LLC and company filings
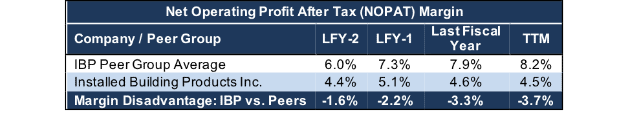
IBP is growing revenue but is not effectively converting that revenue into profit as well as peers. From 2013-2016, IBP’s NOPAT margins improved three percentage points, just 20 basis points greater than the peer average. Since then, peers’ margins have continued rising, up 30 basis points, while IBP’s have fallen 60 basis points, where they remain well below peers, per Figure 4 It’s closest peer, TopBuild Corp (BLD), which is the largest installer and distributor of insulation products in the U.S., has grown NOPAT margins from 5.8% in 2015 to 6.2% TTM.
Figure 4: IBP’s NOPAT Margin Disadvantage is Growing
Sources: New Constructs, LLC and company filings
IBP’s falling NOPAT margins can be attributed to rapidly increasing expenses. Since 2015, IBP has acquired over $335 million in revenue (based on acquired firm’s revenue at time of acquisition) which drove revenue growth by 31% compounded annually. Over the same time, IBP’s cost of sales, administrative costs, and selling costs have grown 31%, 29%, and 25% compounded annually respectively.
No amount of acquisitions will drive profit growth if IBP is unable to integrate new companies and create cost efficiencies. The proposed benefits of scale have not been realized as distribution, labor, and installation costs must still be managed across many different states, cities, and/or municipalities.
Bull Hopes Ignore Value Destruction in Rapidly Growing Industry
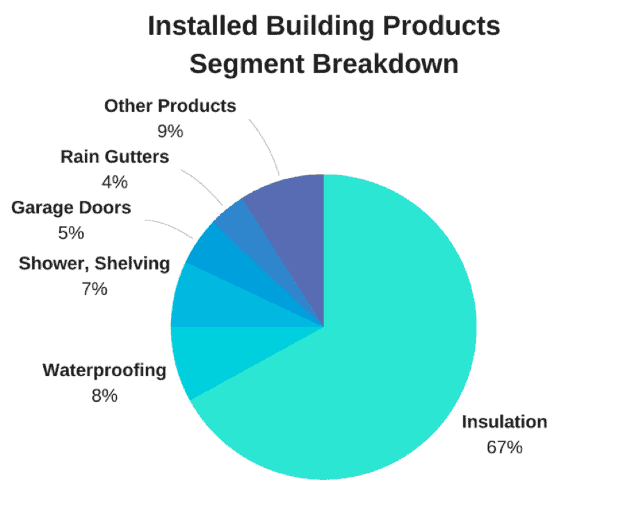
Any bull case for IBP revolves around the continued success of the housing market. 67% of revenue was derived from insulation in 2017, with other construction activities, such as waterproofing, shelving, mirrors, garage doors, and rain gutters comprising the remaining 33%. Figure 5 has more details.
Figure 5: IBP’s Revenue Derived Largely from Insulation
Sources: New Constructs, LLC and company filings
83% of IBP’s revenue comes from residential new construction and repair and remodel, while 17% is from commercial construction.
What should be most alarming to any bull case is the fact that IBP has failed to create shareholder value despite strong growth in its end market, housing. As we noted in our recent Long Idea “Underappreciated Operational Efficiency Could Boost Shares”, the housing market has been improving for many years now.
Annualized new home sales have grown 14% compounded annually since March 2012. The Housing Market Index, a survey of single-family housing market conditions, came in at 68 in April, which marks 46 consecutive months above 50. A reading above 50 indicates positive sentiment given the current market. The remodel market has seen a similar growth trajectory since the housing crash in 2008/2009. The Remodeling Market Index, which provides insights on current remodeling conditions, ended 1Q18 at 57. Any reading above 50 indicates that remodeling activity is higher compared to the prior period. 1Q18 marks the 20th consecutive quarter the RMI has been above 50. Prior to this, the longest the RMI (which dates back to 2001) remained above 50 was 10 consecutive quarters, from early 2003 to late 2005.
The housing market may not be in imminent danger of a crash, but it’s hard to bet that it will get much better than it has been for the past few years. IBP’s inability to create shareholder value on pace with peers in an ideal market should give shareholders concern for how it will handle weaker conditions in the future.
Bull Hopes Need Roll-Up Strategy to Continue
Roll-ups can drive big stock gains in the short-term, but they’re rarely sustainable in the long-term. With each acquisition, the ability to “move the EPS needle” shrinks. Acquiring $100 million in revenue is impactful when the acquirer generates $1 billion in revenue. As the acquirer gets larger, it runs out of firms that are big enough to generate significant growth.
Rising interest rates further limit the viability of continuing a roll-up strategy. Rising rates make debt more costly, which in turn make any potential acquisition more expensive while also limiting the ability to earn a quality return.
IBP has committed to a strategy that is destroying shareholder value and is not sustainable. Nevertheless, the market values the company at a premium to its peers, as we’ll show below.
IBP Is Overvalued Compared to Peers
Numerous case studies show that getting ROIC right is an important part of making smart investments. Ernst & Young recently published a white paper that proves the material superiority of our forensic accounting research and measure of ROIC. The technology that enables this research is featured by Harvard Business School.
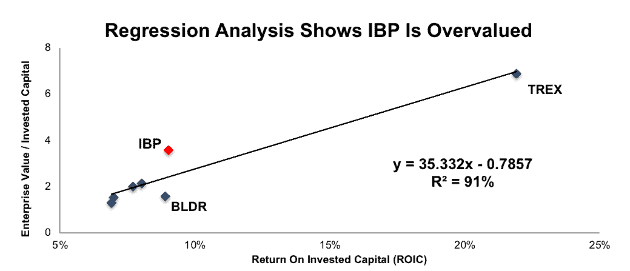
Figure 6, regresses the ROIC of IBP and its peer group, as listed in its latest proxy statement, against enterprise value divided by invested capital (a cleaner version of price to book). As you can see, ROIC explains 91% of the difference in valuation for IBP’s peers.[1]
Figure 6: ROIC Explains 91% of Valuation for Installed Building Products’ Peers
Sources: New Constructs, LLC and company filings
IBP’s position above the trend line means its shares trade at a premium to peers. If the stock were to trade at parity with the peer group, it would be $35/share – 40% below the current stock price.
At IBP’s current valuation, the market expects its ROIC to increase to from 9.0% to 12.4%. We think it’s more likely that the company’s ROIC will continue to decline than that it will meet these expectations.
IBP Valuation Requires Overly Optimistic Assumptions
Even if you believe that IBP can reverse its declining margins and efficiently manage each of its acquisitions, such optimism is already reflected in the stock price. IBP’s current valuation implies that it will immediately improve margins and significantly grow profits for years to come, as shown below.
Despite the fundamental deterioration, investors have clearly bought into the rising non-GAAP metrics, and IBP is up 79% over the past two years, while the S&P is up 30%. This rapid price appreciation has left IBP significantly overvalued, both by traditional metrics and when analyzing the expectations baked into the stock price. IBP’s P/E ratio of 45.5 is well above the Industrials sector average of 22.8 and the S&P 500 average of 24.6. When we analyze the cash flow expectations baked into the stock price, we also find that IBP faces significant downside risk.
To justify its current price of $58/share, IBP must maintain TTM pre-tax margins of 6.8% (while benefiting from a decline in its cash tax rate to 21%, down from 34%) and grow NOPAT by 14% compounded annually for the next 11 years. See the math behind this dynamic DCF scenario here.
In this scenario, IBP would grow revenue at consensus expectations in year 1 (16%) and year 2 (12%), and 12% each year thereafter (continuation of consensus expectations). For reference, Grand View Research, a market research provider, expects the global insulation market to grow at 8.6% compounded annually through 2025. In other words, this scenario implies IBP will continue growing revenue above the industry rate, while also reversing recent margin deterioration.
Even in a very optimistic scenario, IBP holds significant downside. If we assume IBP can maintain TTM pre-tax margins, benefit from a lower cash tax rate, and grow NOPAT by 10% compounded annually for the next decade, the stock is worth only $36/share today – a 38% downside. See the math behind this dynamic DCF scenario here.
Each of these scenarios also assumes IBP is able to grow revenue, NOPAT and FCF without increasing working capital or fixed assets. This assumption is unlikely given the acquisitive nature of IBP’s business, but allows us to create best-case scenarios that demonstrate how high expectations embedded in the current valuation are. For reference, IBP’s invested capital has grown on average $113 million (10% of 2017 revenue) over the past four years.
Is IBP Worth Acquiring?
Often the largest risk to any bear thesis is what we call “stupid money risk”, which means an acquirer comes in and pays for IBP at the current, or higher, share price despite the stock being overvalued. An acquisition could come from a larger firm in the insulation installation industry, such as TopBuild Corp (BLD). BLD has shown a willingness to acquire competition with its recent $475 million acquisition of United Subcontractors. However, such a deal could face antitrust concerns, as BLD and IBP are the two largest companies in the insulation market.
A homebuilder could also view IBP as a vertical integration target. However, as noted in a report by housingeconomics.com, 77% of construction costs are subcontracted, and the larger a homebuilder, the more work they subcontract out. As Professional Builder, a homebuilding magazine, puts it, homebuilders are better suited to focus on core competencies and diversify their subcontracting resources rather than bring everything in house.
Regardless of the type of firm that could look to acquire IBP, the lack of success of its roll-up strategy makes the firm less likely to be scooped up. With each acquisition, the firm takes on more debt, has more moving parts with escalating costs, and becomes less attractive to a potential acquirer. Ultimately, any firm looking to acquire IBP would be imprudently allocating capital and destroying substantial shareholder value in an acquisition.
We show below how expensive IBP remains even after assuming an acquirer can achieve significant synergies.
Walking Through the Acquisition Value Math
To begin, Installed Building Products has liabilities of which investors may not be aware that make it more expensive than the accounting numbers suggest.
- $35 million in off-balance-sheet operating leases (2% of market cap)
- $7 million in net deferred tax liabilities (<1% of market cap)
After adjusting for these liabilities, we can model multiple purchase price scenarios. Even in the most optimistic of scenarios, IBP is worth less than its current share price.
Figures 7 and 8 show what we think TopBuild Corp (BLD) should pay for IBP to ensure it does not destroy shareholder value. While purely hypothetical, acquiring IBP would immediately increase BLD’s already leading market share of the insulation installation market and increase its geographic reach. However, there are limits on how much BLD would pay for IBP to earn a proper return, given the NOPAT or free cash flows (or lack thereof) being acquired.
Each implied price is based on a ‘goal ROIC’ assuming different levels of revenue growth. In both scenarios, the estimated revenue growth rate is 16% in year one and 12% in year two, which is the consensus estimates for IBP’s revenue growth. For the subsequent years, we use 12% in scenario one because it represents a continuation of consensus estimates. We use 17% in scenario two because it assumes a merger with BLD would create additional revenue opportunities as the combined firm would be the leading insulation firm in the country.
We conservatively assume that BLD can grow IBP’s revenue and NOPAT without spending anything on working capital or fixed assets beyond the original purchase price. We also assume IBP immediately achieves a 6.2% NOPAT margin, which is equal to BLD margins. For reference, IBP’s TTM NOPAT margin is just 4.5%, so this assumption implies immediate improvement and allows the creation of a truly best-case scenario.
Figure 7: Implied Acquisition Prices for BLD to Achieve 7% ROIC
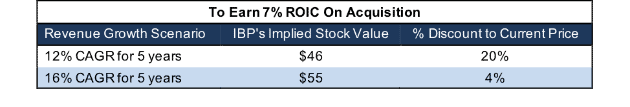
Sources: New Constructs, LLC and company filings.
Figure 7 shows the ‘goal ROIC’ for BLD as its weighted average cost of capital (WACC) or 7%. Even if IBP can grow revenue by 16% compounded annually, with a 6% NOPAT margin for the next five years, the firm is worth less than its current price of $58/share. It’s worth noting that any deal that only achieves a 7% ROIC would only be value neutral and not accretive, as the return on the deal would equal BLD’s WACC.
Figure 8: Implied Acquisition Prices for BLD to Achieve 8% ROIC
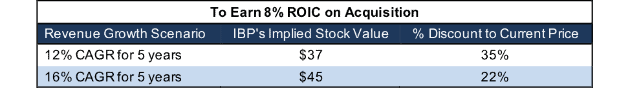
Sources: New Constructs, LLC and company filings.
Figure 8 shows the next ‘goal ROIC’ of 8%, which is BLD’s current ROIC. Acquisitions completed at these prices would be truly accretive to BLD shareholders. Even in the best-case growth scenario, the implied stock value is less than the current price. Even assuming this best-case scenario, BLD would destroy nearly $800 million by purchasing IBP at its current valuation. Any scenario assuming less than 16% compound annual growth in revenue would result in further capital destruction for BLD.
Cash Runs Out, Roll-Up Scheme Slows or a Slowing Housing Market Could Sink Shares
Roll-up strategies can carry on for quite some time, but the significant downside experienced when they run out of steam is well documented. For example, see our reports on InnerWorkings (INWK), which fell 50% at its worst, and Valeant (VRX), which still trades 65% lower since we published our original Danger Zone report.
The roll-up strategy either runs out of acquisition targets or is no longer able to keep up the illusion of non-GAAP profits. As we saw with Valeant, non-GAAP earnings do not pay cash costs, and with IBP’s climbing debt, it could only be a matter of time before the roll-up runs out of steam. In such an instance, investors would be forced to measure the firm on its fundamentals, which as shown above, do not warrant such a lofty valuation.
Beyond the roll-up, annualized new home sales are reaching historical averages, which could point to slowing demand in the near-term. Over the past 30 years, new home sales averaged 696 thousand per year. In March 2018, annualized sales reached 694 thousand. While housing may not get worse, it will be hard pressed to grow as well as it has in recent years moving forward.
Additionally, mortgage rates reached their highest point since 2011, according to mortgage provider Freddie Mac. Rising mortgage rates, along with rising home prices, could limit IBP’s growth potential in the coming years.
Should these issues begin to impact IBP’s ability to acquire revenue or keep the roll-up rolling, investors could run for exits and send shares sliding to a more rational level.
Insider Trading Fails to Inspire Confidence and Short Interest is Minimal
Over the past 12 months, 1.4 million insider shares have been sold and 77 thousand have been purchased for a net effect of 1.3 million insider shares sold. These sales represent 4% of shares outstanding and fail to create confidence in the long-term prospects of the business.
Short interest is currently 1.3 million shares, which equates to 4% of shares outstanding and six days to cover. Short interest fell 4% over the prior month but remains near its 52-week high. Short interest could rise if IBP fails to find suitable roll-up firms and earnings fail to beat expectations.
Critical Details Found in Financial Filings By Our Robo-Analyst Technology
As investors focus more on fundamental research, research automation technology is needed to analyze all the critical financial details in financial filings. Below are specifics on the adjustments we make based on Robo-Analyst[2] findings in Installed Building Products’ 2017 10-K:
Income Statement: we made $37 million of adjustments, with a net effect of removing $11 million in non-operating expenses (1% of revenue). We removed $13 million in non-operating income and $24 million in non-operating expenses. You can see all the adjustments made to IBP’s income statement here.
Balance Sheet: we made $143 million of adjustments to calculate invested capital with a net decrease of $15 million. One of the largest adjustments was $35 million related to operating leases. This adjustment represented 6% of reported net assets. You can see all the adjustments made to IBP’s balance sheet here.
Valuation: we made $401 million of adjustments with a net effect of decreasing shareholder value by $401 million. There were no adjustments that increased shareholder value. Apart from $394 million in total debt, which includes the $35 million in operating leases noted above, the most notable adjustment to shareholder value was $7 million in deferred tax liabilities. This tax adjustment represents <1% of IBP’s market cap.
Unattractive Funds That Hold IBP
The following funds receive our Unattractive-or-worse rating and allocate significantly to Installed Building Products.
- Putnam Small Cap Growth Fund (PNSBX) – 2.1% allocation and Very Unattractive rating
- PNC Small Cap Fund (PPCAX) – 1.9% allocation and Unattractive rating
- Harbor Small Cap Growth Fund (HNSGX) – 1.7% allocation and Very Unattractive rating
This article originally published on May 21, 2018.
Disclosure: David Trainer, Kyle Guske II, and Sam McBride receive no compensation to write about any specific stock, style, or theme.
Follow us on Twitter, Facebook, LinkedIn, and StockTwits for real-time alerts on all our research.
[1] Ernst & Young’s recent white paper “Getting ROIC Right” demonstrates the link between an accurate calculation of ROIC and shareholder value.
[2] Harvard Business School features the powerful impact of our research automation technology in the case study New Constructs: Disrupting Fundamental Analysis with Robo-Analysts.
Click here to download a PDF of this report.
Photo Credit: Jens (Pexels)