We closed this position on June 28, 2017. A copy of the associated Position Update report is here.
Check out this week’s Danger Zone interview with Chuck Jaffe of Money Life and Marketwatch.com
Stop us if you’ve heard this story before: slowing organic revenue growth, questionable non-GAAP metrics, and a large investment by activist Bill Ackman. No, we’re not talking about Valeant Pharmaceuticals (VRX), which is down 53% since we put it in the Danger Zone in late February. This time, we’re talking about Mondelez International (MDLZ: $40/share), which lands in the Danger Zone this week and looks a lot like VRX.
2015 Results Artificially Propped Up
Mondelez’s GAAP net income grew 233% year over year in 2015. At the same time, economic earnings, or true cash flows, declined from -$949 million in 2014 to -$1.32 billion in 2015. The large discrepancy comes from Mondelez’s $6.8 billion of non-operating income related to gains on coffee business transactions and divestitures. Over the long-term, Figure 1 shows results are no better. Despite GAAP net income growing 16% compounded annually since 2009, economic earnings have remained negative and fallen from -$281 million in 2009 to -$1.32 billion in 2015.
Figure 1: The Disconnect Between GAAP & Economic Earnings
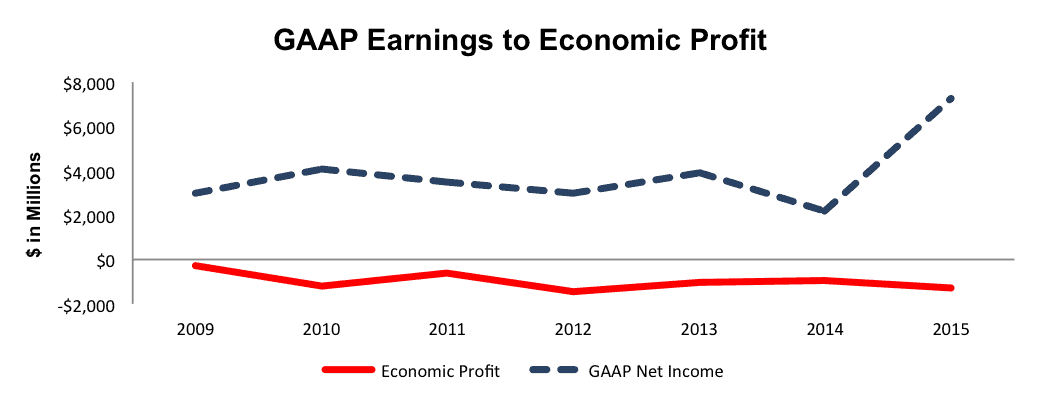
Sources: New Constructs, LLC and company filings
The decline in economic earnings follows the decline in Mondelez’s return on invested capital (ROIC). Since earning a high of 8% in 2002, Mondelez’s ROIC has slowly declined to its current 5%. As Mondelez has grown, acquired stakes in other brands, and entered/exited new businesses, the company’s operations have become less efficient.
Watch Out For Questionable Non-GAAP Metrics
Non-GAAP metrics present significant dangers to investors. We remain surprised by how often companies use non-GAAP metrics to cover up weak businesses, and Mondelez is an egregious user of non-GAAP metrics. Here are details:
- Organic Net Revenue – net revenue excluding the impacts of acquisitions, divestitures, historical coffee business, Integration Program costs, and currency rate fluctuations.
- Adjusted Gross Profit – gross profit excluding the 2012-2014 restructuring program, the 2014-2018 restructuring program, the Integration Program, other acquisition integration costs, incremental costs with coffee business transactions, and the operating results of divestitures.
- Adjusted Operating Income – operating income that excludes 15 separate items including costs associated with coffee business, impairment charges related to goodwill and intangible assets, and acquisition costs.
- Adjusted EPS – diluted EPS attributable to Mondelez, which excludes 15, separate items, including spin off costs, hedging gains or losses, impairment charges, and acquisition related costs.
Clearly, these contrived metrics remove numerous standard costs of doing business, especially for an international company like Mondelez. Perhaps, most misleading is Mondelez’s removal of currency rate fluctuations from “Organic Net Revenue” given that 76% of sales generated outside of the U.S. in 2015. Not surprisingly, Mondelez reported “Organic Net Revenue” growth of 3.7% year over year in 2015, while GAAP revenue declined 13%.
Low Profitability Is A Competitive Disadvantage
Companies with lower ROICs have lower pricing power. In 2015, Mondelez pushed rising input costs onto consumers by increasing prices for its goods. This move only temporarily delays further margin contraction. MDLZ executives have openly stated that they expect price competition or delayed price increases by competitors to affect net revenue and/or market share. As the least profitable among its peers (see Figure 2), MDLZ will likely continue to be the first to raise prices and the first to lose market share to competitors who can withstand higher input costs for longer.
Figure 2: Mondelez’s Lagging Profitability Creates Issues
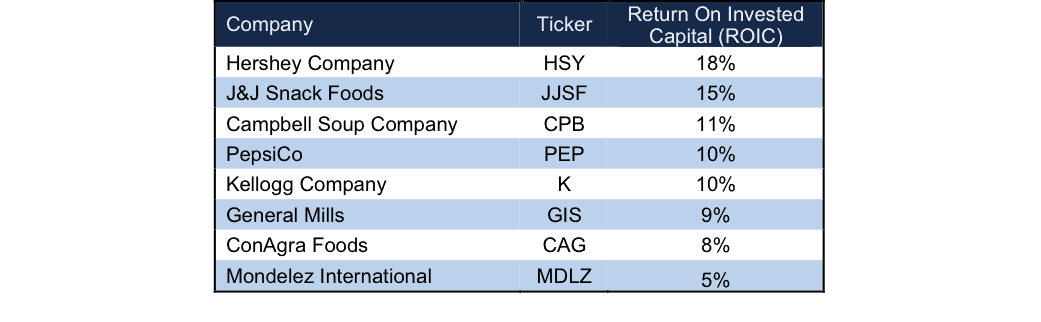
Sources: New Constructs, LLC and company filings
Bulls Need To Accept Lower Growth as “The New Normal”
Lower profitability and growth are the new normal for Mondelez, and the stock’s value will eventually align once investors stop believing in non-GAAP earnings. Mondelez’s revenue has declined 14% compounded annually, and its net operating profit after-tax (NOPAT) has declined 13% compounded annually since 2011. We do not believe a return to growth achieved prior to 2011 will happen given the company’s weak competitive position and limited growth prospects in a crowded and competitive market.
Making matters worse, MDLZ has become more expensive as operations have deteriorated. In 2011, MDLZ had a price to economic book value (PEBV) ratio of 2. This ratio implied that MDLZ could grow NOPAT by 200%. Since then, as revenue and profits have fallen, MDLZ’s PEBV has increased to 2.8, which would imply the company can grow NOPAT by 280%, an assumption that seems ever more unlikely.
We think too many investors are being fooled by the “adjusted” metrics and do not realize that the company’s business is deteriorating instead of improving.
MDLZ Unlikely To Be Acquired, But Overvalued Nonetheless
Of the competitors in Figure 2, only PepsiCo (PEP) has a higher market cap. With Mondelez owning many different brands ranging from cookies to gum to chocolate, it would seem possible that the company spins off some of these assets. However, when stocks are as expensive as MDLZ, we think it helps to quantify what, if any, acquisition hopes are priced into the stock.
First, investors need to know that Mondelez has large (hidden) liabilities that make it more expensive than the accounting numbers would initially suggest.
- $16.7 billion in fair value of total debt (27% of market cap)
- $4.8 billion in net deferred tax liabilities (8% of market cap)
- $2.8 billion in underfunded pensions (5% of market cap)
- $658 million in outstanding employee stock options (1% of market cap)
Looking past these hidden liabilities, Mondelez doesn’t represent an attractive takeover target at its current price. For the sake of argument, let’s assume PepsiCo wishes to acquire MDLZ. If we assume that MDLZ immediately achieves PepsiCo’s margins and ROIC, Mondelez would still have to grow NOPAT by 13% compounded annually for six years to justify purchase at its current stock price. Keep in mind that over the past six years, MDLZ’s NOPAT has declined by 4% compounded annually. A more realistic price PepsiCo should pay is $22/share (45% downside from current share price), which is the value of Mondelez’s business based on the value of the firm if it achieves PepsiCo’s 12% NOPAT margin in year one of the acquisition.
Assuming the firm is not acquired, if Mondelez can grow NOPAT by 7% compounded annually for the next decade, the stock is worth only $23/share today – a 43% downside.
Market “Wake-Up” Could Sink MDLZ
While we don’t expect MDLZ to fall as violently, some lessons can be taken from VRX and could foreshadow a fall in MDLZ.
- Companies can only prop up earnings through non-GAAP metrics for so long. Eventually, even the artificial growth comes to an end, at which point, no “adjusted” metrics will satisfy the market.
- Executive compensation that is tied to poor metrics, as we’ll show below, leads to strategic decisions that maximize short-term gains while destroying shareholder value.
Lastly, stocks in the Danger Zone have taken quite a beating over the last year. It seems that more investors are paying attention to our warnings. Many of our best Danger Zone picks from 2015 were companies whose management teams relied heavily on non-GAAP metrics to keep investors in the dark. It’s not a matter of “if”, but rather, “when” the non-GAAP metrics can no longer mask problems.
Insider Sales and Short Interest Remain Low
Over the past 12 months 960,000 shares have been purchased and 582,000 shares have been sold for a net effect of 378,000 insider shares purchased. These purchases represent <1% of shares outstanding. Additionally, there are 19 million shares sold short, or just over 1% of shares outstanding.
Executive Compensation Still Flawed, But May Be Improving
Mondelez’s executive compensation in the past has failed to focus on metrics that drive shareholder value. Annual executive cash bonuses are paid based on “Organic Net Revenue” growth, “Adjusted EPS”, and defined free cash flow. Two of these metrics we detailed above and allow management significant leeway in ensuring they meet their target. Performance share bonuses have in the past been based upon “Organic Revenue Growth”, “Adjusted EPS” growth, and total shareholder return. Beginning in 2014, MDLZ chose to replace “Adjusted EPS” with Adjusted Return on Invested Capital. We view this as a positive development, as there is a clear correlation between ROIC and shareholder value. Unfortunately, ROIC only determines one fourth of the stock unit bonus and doesn’t affect cash bonuses. As it stands, MDLZ’s executive compensation plan is misaligned with shareholder value, but the addition of ROIC as a performance benchmark is a step in the right direction.
Impact of Footnotes Adjustments and Forensic Accounting
In order to derive the true recurring cash flows, an accurate invested capital, and a real shareholder value, we made the following adjustments to Mondelez’s 2015 10-K:
Income Statement: we made $12.3 billion of adjustments with a net effect of removing $4.1 billion in non-operating income (14% of revenue). We removed $4.1 billion related to non-operating expenses and $8.2 billion related to non-operating income.
Balance Sheet: we made $15.4 billion of adjustments to calculate invested capital with a net increase of $13.7 billion. The most notable adjustment was $9.9 billion (19% of net assets) related to other comprehensive income.
Valuation: we made $25.4 billion of shareholder value adjustments with a net decrease of $24.6 billion. The largest adjustment was the removal of $16.7 billion (27% of market cap) in total debt, which includes $863 million in off balance sheet operating leases.
Dangerous Funds That Hold MDLZ
The following fund receives our Dangerous rating and allocates significantly to Mondelez International.
- Primary Trend Fund (PTFDX) – 5.3% allocation and Very Dangerous rating.
- John Hancock US Global Leaders Growth Fund (USGLX) – 4.0% allocation and Dangerous rating.
- Gabelli SRI Fund, Inc. (SRIAX) – 3.9% allocation and Very Dangerous rating
Disclosure: David Trainer and Kyle Guske II receive no compensation to write about any specific stock, style, or theme.