This position was closed due to acquisition on August 1, 2019. Details in the Position Update report here.
This week’s Danger Zone pick saw its stock price rise over 140% from mid 2014 to mid 2015. In the second half of 2015, the stock would fall nearly 70%. More recently, the stock is back on the upswing and is up 23% year-to-date, while the S&P is up just 6%. The fundamentals of the business don’t justify this price move. In fact, negative margins, strong competition, and the overvalued stock price land Tableau Software (DATA: $53/share) in the Danger Zone this week.
Revenue Growth Without The Profits To Show
Tableau Software’s after-tax profit (NOPAT) declined from $4 million in 2012 to -$119 million in 2016. This decline in profit comes despite revenue growing 59% compounded annually over the same time, per Figure 1.
Figure 1: DATA’s Revenue Growth Leads to Losses
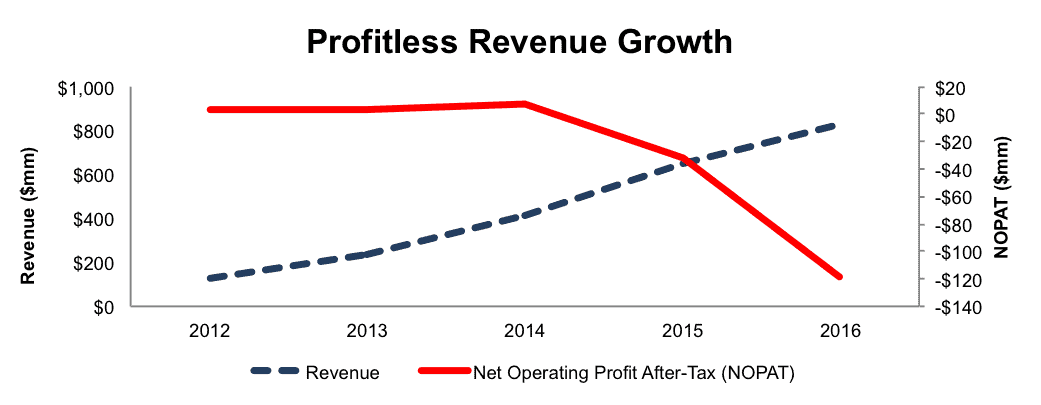
Sources: New Constructs, LLC and company filings
The company’s return on invested capital (ROIC) is currently a bottom-quintile -29% and its NOPAT margin was -14% in 2016. Additionally, Tableau has burned through a cumulative $604 million (15% of market cap) in free cash flow over the past four years. Despite impressive revenue growth, Tableau’s fundamentals are trending in the wrong direction.
Compensation Plan Misaligns Executive Interests
Tableau Software’s executive compensation plan fails to properly align executives’ interests with shareholders’ interests. The misalignment drives the profit losses shown in Figure 1. Worse, the current compensation plan allows executives to earn large bonuses while shareholder value is destroyed.
Tableau executives are eligible for base salaries, cash incentives, and long-term equity awards. The cash bonuses are tied to the achievement of target “bookings.” “Bookings” a non-GAAP metric, represent the first year of contracted revenue. However, per Tableau’s 2016 financial results press release, “bookings is not a measure of revenue or an indication of actual revenue results.” Meanwhile, management actively tracks and touts bookings as signs of success.
Long-term equity awards are given in the form of restricted stock units. The compensation committee, in consultation with the CEO, determines the size and terms of equity awards. Items taken into account during this review include role and responsibility of the executive, individual performance, competitive factors, and retention objectives. Unfortunately, these rather subjective performance metrics do little to ensure alignment of interests between the agents and owners of capital for Tableau.
We’ve demonstrated through numerous case studies that ROIC, not “bookings” or other non-GAAP metrics, is the primary driver of shareholder value creation. Without major changes to this compensation plan (e.g. emphasizing ROIC), investors should expect further value destruction. In addition, we suggest the board of directors, especially the compensation committee, consider their culpability and responsibility for the misalignment of interests.
Non-GAAP Metrics Mask The Firm’s Losses
Tableau uses non-GAAP metrics such as non-GAAP gross profit, non-GAAP operating profit, and non-GAAP net income to create the illusion of profits. Our research digs deeper so our clients see through the illusory numbers. Below are some of the items Tableau removes to calculate its non-GAAP net income:
- Stock-based compensation expense
- Amortization of acquired intangible assets
These adjustments have a large impact on the disparity between GAAP net income, non-GAAP net income, and economic earnings. In 2016 and 2015, Tableau removed over $185 million (22% of revenue) and $119 million (18% of revenue) respectively in expenses related to stock-based compensation to calculate non-GAAP net income. When added with the other adjustments, Tableau reported 2016 non-GAAP net income of $34 million. Per Figure 2, GAAP net income was -$144 million and economic earnings were -$156 million in 2016.
Figure 2: Disconnect Between Non-GAAP & Economic Earnings
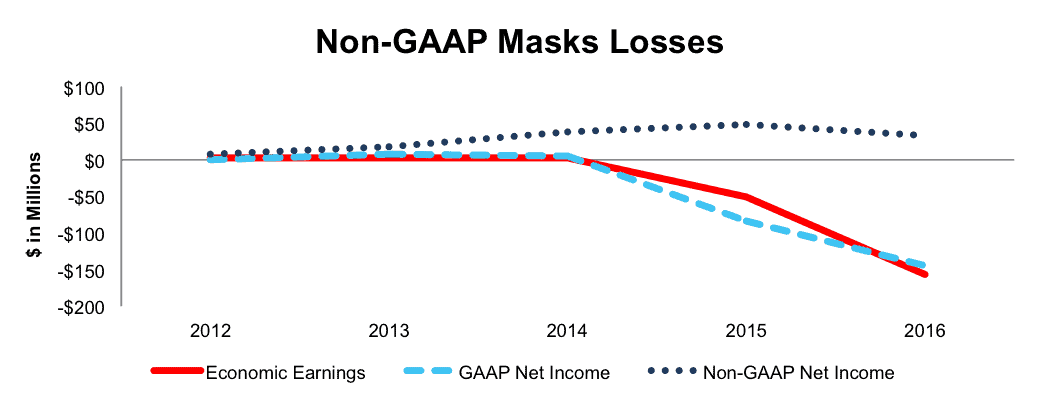
Sources: New Constructs, LLC and company filings
Negative Profitability Amidst Highly Profitable Competition
Tableau Software provides tools that help clients see and understand data. Tableau operates directly in the data visualization market and more broadly in the business intelligence/analytics market. These markets are occupied by some of the largest tech firms in the world, such as Microsoft (MSFT), Oracle Corporation (ORCL), salesforce (CRM), and International Business Machines (IBM). The large competitors offer entire business analytics suites, such as Oracle Business Intelligence, salesforce Cloud, and Microsoft Dynamics.
The important takeaway from Figure 3 is Tableau’s ROIC and NOPAT margin rank below all competitors. The firms with the highest profitability in the industry are those that offer much more than just data visualization. Many of their competitors can bundle data visualization into larger services that include enterprise resource planning, supply chain management, or even database management. This bundled economy of scale allows competitors to more easily provide discounts and lower prices, as in the case of Amazon QuickSight, which claims to be one-tenth the cost of traditional solutions. Bundling can also allow firms to offer data visualization for free, as Microsoft did when it released a free version of its Power BI tool. As a standalone data visualization provider, Tableau doesn’t have the ability to bundle discounts without cutting into already negative margins.
Figure 3: Tableau Software’s Negative ROIC & Margins
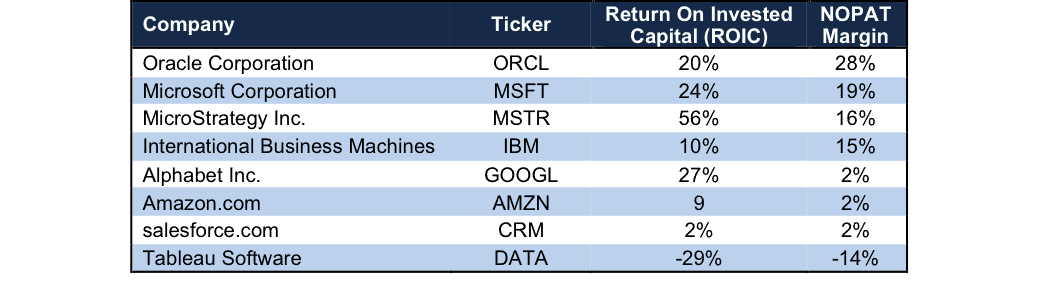
Sources: New Constructs, LLC and company filings
Bulls Case Ignores Slowing Revenue and Rising Costs
Tableau bulls will point to the firm’s impressive revenue growth and growing market as reason to invest in the company. Many will also argue that with just a few cost controls, Tableau could be a profitable firm. However, each of these viewpoints ignores the fact that revenue growth is slowing, while exorbitant costs continue to undermine the bottom line. In 2016, revenue grew 27% year-over-year (YoY), which is down from 82% YoY in 2013. In order to continue growing revenue at high (yet declining) rates, Tableau has had to increase its spending, which has led to its NOPAT margin falling from 3% in 2012 to negative 14% TTM, per Figure 4.
Figure 4: Sacrificing Profits To Grow Revenue
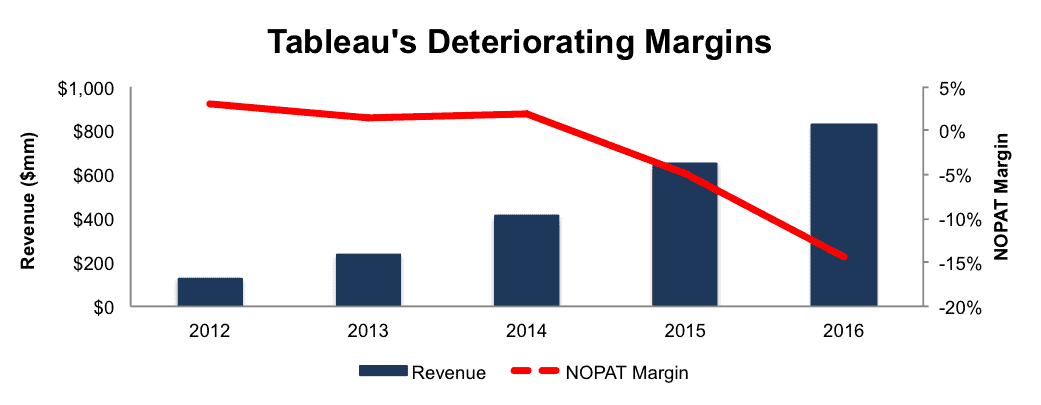
Sources: New Constructs, LLC and company filings.
Making matters worse, Tableau is not in a position to cut costs and reach profitability. With significant competition, the firm must enhance its product offering to provide better value or risk falling behind its better-funded competition. Heavy marketing spending is required to improve product awareness. When asked about growth vs. profitability on the recent quarterly conference call, CFO Thomas Walker noted that in order to maintain Tableau’s market position, the firm must continue innovating through investing and expansion.
Comments like these should give profit-hopeful investors pause. Tableau’s cost growth already outpaces its revenue growth, yet the firm must continue investing to maintain market share. Without willingness to give up market share in exchange for profits, this business model is no recipe for success.
Figure 5 shows that the firm’s operating expenses make up an increasingly larger percentage of revenue. In 2016, operating expenses were 105% of revenue, up from 89% of revenue in 2012
Figure 5: DATA’s Operating Expenses As % Of Revenue
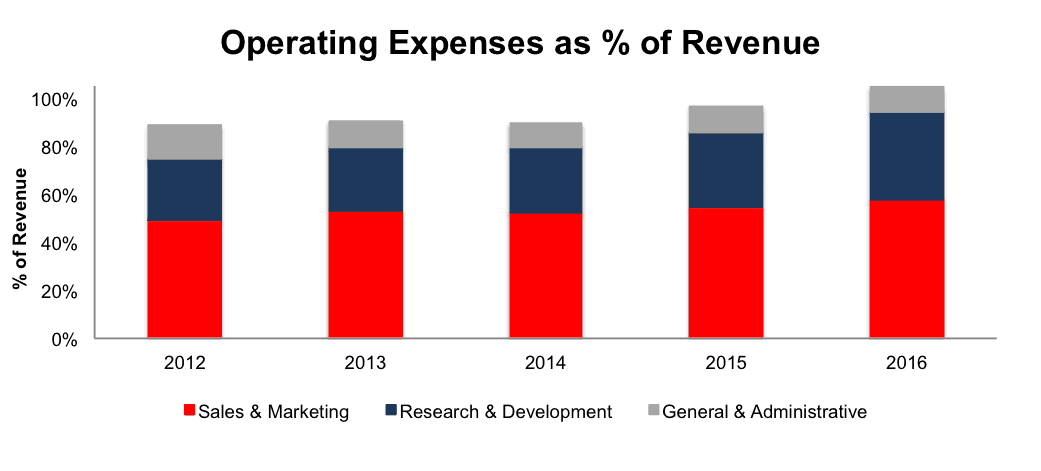
Sources: New Constructs, LLC and company filings
Per Figure 6, Tableau’s research & development, sales & marketing, and general & administrative costs have grown 74%, 66%, and 49% compounded annually, respectively, since 2012. Over the same time, Tableau’s revenue has grown 59% compounded annually.
Figure 6: DATA’s Operating Expenses Growing Faster Than Revenue

Sources: New Constructs, LLC and company filings
Tableau’s valuation represents the biggest hole in any bull case. In fact, the data analytics and visualization markets may not be growing fast enough for Tableau to ever justify its valuation. From 2015-2021, the business intelligence market is expected to grow 8% compounded annually. Meanwhile, the data visualization market is expected to grow 9% compounded annually from 2016-2020. The expectations already baked into DATA’s price imply that Tableau will grow much faster than the entire industry and take nearly all market share, as we’ll show below.
Large Downside Risk When Investing In DATA
To justify its current price of $53/share, DATA must achieve NOPAT margins of 9% (average of firms in Figure 3, compared to -14% in 2016) and grow revenue by 20% compounded annually for the next 11 years. In this scenario, Tableau would be generating over $6 billion in revenue 11 years from now. For reference, the entire data visualization market was valued at $4 billion in mid 2016 and expected to grow to $7 billion by 2020. This scenario also seems unlikely given that Tableau estimates revenue will grow only 5% year over year in 2017. Ultimately, the expectations already baked into the stock price imply Tableau will take nearly all market share while also drastically improving its profit margins.
Even if we assume DATA can achieve a 9% NOPAT margin and grow revenue by 9% compounded annually for the next decade, the stock is worth only $23/share today – a 57% downside. Each of these scenarios also assumes DATA is able to grow revenue and NOPAT/free cash flow without spending on working capital or fixed assets. This assumption is unlikely but allows us to create very optimistic scenarios that demonstrate how high expectations in the current valuation are. For reference, DATA’s invested capital has grown on average $116 million (14% of 2016 revenue) per year over the last four years.
Is DATA Worth Acquiring?
The largest risk to our bear thesis is what we call “stupid money risk”, which means an acquirer comes in and pays for DATA at the current, or higher, share price despite the stock being overvalued. Prior Danger Zone pick and competitor, Qlik Technologies, was acquired by private equity firm Thoma Bravo in mid 2016. Many are betting that Tableau will be the next M&A target, but the landscape has shifted since and makes a similar white-knight acquisition of Tableau less likely.
First, Thoma Bravo chose to acquire Qlik over Tableau when both were available. At the time, Tableau had a higher ROIC than Qlik, and its revenues were growing faster, yet Thoma Bravo still chose Qlik. Since the acquisition, Tableau’s ROIC has fallen from 14% to -29%. Perhaps Thoma Bravo’s analysis revealed the future of Tableau was not good enough to justify the cost of an acquisition.
Second, Tableau may not be particularly attractive to traditional tech firms that already have similar competing products, as noted above. The willingness to overpay for a data visualization provider is diminished since the acquisition would only provide marginal benefits over an existing product. We see an acquisition as possible only if an acquiring firm is willing to ignore prudent stewardship of capital and destroy substantial shareholder value.
We show below how expensive DATA remains even after assuming an acquirer can gain significant synergies.
To begin, DATA has liabilities of which investors may not be aware that make it more expensive than the accounting numbers suggest.
- $326 million in off-balance-sheet operating leases (8% of market cap)
- $183 million in outstanding employee stock options (4% of market cap)
After adjusting for these liabilities we can model multiple purchase price scenarios. Even in the most optimistic of scenarios, DATA is worth less than the current share price.
Figures 7 and 8 show what we think Microsoft (MSFT) should pay for Tableau to ensure it does not destroy shareholder value. Microsoft has not been shy when it comes to acquisitions in the past and acquiring Tableau could instantly improve its data visualization offerings for its many clients. However, there are limits on how much MSFT would pay for DATA to earn a proper return, given the NOPAT of free cash flows being acquired.
Each implied price is based on a ‘goal ROIC’ assuming different levels of revenue growth. In each scenario, the estimated revenue growth rate in year one and two equals the consensus estimate for the current year (7%) and next year (8%). For the subsequent years, we use 8% in scenario one because it represents a continuation of next year’s expectations. We use 15% in scenario two because it assumes a merger with MSFT could create revenue growth through increased platform usage across Microsoft’s business analytics suite.
We conservatively assume that Microsoft can grow Tableau’s revenue and NOPAT without spending on working capital or fixed assets. We also assume Tableau immediately achieves a 9% NOPAT margin, which is the average of firms in Figure 3. For reference, DATA’s TTM NOPAT margin is -14%, so this assumption implies immediate improvement and allows the creation of a truly best case scenario.
Figure 7: Implied Acquisition Prices For MSFT To Achieve 6% ROIC
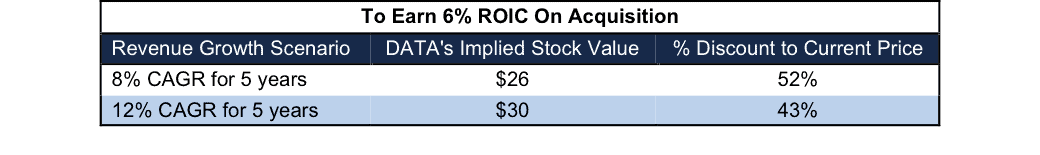
Sources: New Constructs, LLC and company filings.
Figure 7 shows the ‘goal ROIC’ for MSFT as its weighted average cost of capital (WACC) or 6%. Even if Tableau Software can grow revenue by 12% compounded annually with a 9% NOPAT margin for the next five years, the firm is worth less than its current price of $53/share. It’s worth noting that any deal that only achieves a 6% ROIC would be only value neutral and not accretive, as the return on the deal would equal MSFT’s WACC.
Figure 8: Implied Acquisition Prices For MSFT To Achieve 24% ROIC
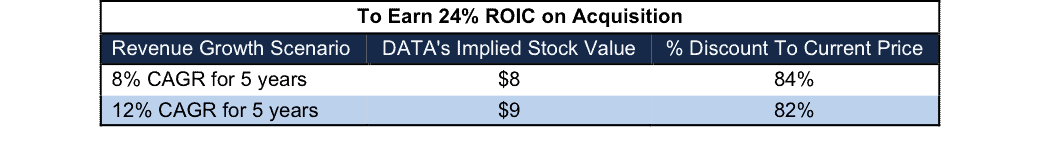
Sources: New Constructs, LLC and company filings.
Figure 8 shows the next ‘goal ROIC’ of 24%, which is Microsoft’s current ROIC. Acquisitions completed at these prices would be truly accretive to MSFT shareholders. Even in the best-case growth scenario, the most MSFT should pay for DATA is $9/share (82% downside). Even assuming this best-case scenario, MSFT would destroy over $3 billion by purchasing DATA at its current valuation. Any scenario assuming less than 12% CAGR in revenue would result in further capital destruction for MSFT.
Unrealistically High Expectations Make This Stock Very Risky
The big decision Tableau must make going forward is whether to focus on revenue growth or profitability.
Up to this point, Tableau has been unable to grow revenue without a commensurate increase in operating expenses. After burning through -$283 million in free cash flow in 2016, Tableau will eventually reach a point where its current business model is unsustainable. Given the firm’s $908 million in cash and equivalents, it can sustain its current cash burn rate for just over three years without a dilutive capital raise or filing for bankruptcy. But, we doubt investors will wait that long.
Given this fact, one has to question whether it makes any sense to continue focusing on revenue growth and market share. It’s clear such an approach has a limited life-span.
Meanwhile, a focus on profitability could cause an immediate cut in DATA’s valuation, as the revenue growth/market share crowd flees the stock. Even if we assume the firm could immediately reach profitability, the slowed revenue growth would not allow the firm to reach the expectations ($6 billion in revenue) implied in the current market valuation.
The stock is between a rock and a hard place when it comes to the growth versus profitability tradeoff. While we cannot predict exactly when the company might fall short of the high expectations embedded in the stock price, we can write with confidence that the company only has three years to right the ship and meet market expectations for growth and profits. In the meantime, investors could get squeamish at any moment, and we could see a precipitous drop anytime. It has happened before.
In 2Q16, after earnings came in below consensus, DATA fell 6%. In 3Q16, when revenue was below expectations, the stock fell 13%.
Tableau must consistently beat expectations or watch its valuation fall to more rational levels. We believe Tableau is likely to face a similar fate as recent Danger Zone Pick Palo Alto Networks, which fell 24% on 3/1 after revenue missed consensus estimates.
Insider Action Is Minimal While Short Interest Is Noteworthy
Over the past 12 months, 2.5 million insider shares have been purchased and 1.8 million have been sold for a net effect of 650 thousand insider shares purchased. These purchases represent less than 1% of shares outstanding. Additionally, there are 6.1 million shares sold short, or 8% of shares outstanding. It appears the market is skeptical of DATA’s valuation.
Impact of Footnotes Adjustments and Forensic Accounting
In order to derive the true recurring cash flows, an accurate invested capital, and a real shareholder value, we made the following adjustments to Tableau Software’s 2016 10-K:
Income Statement: we made $30 million of adjustments with a net effect of removing $26 million in non-operating expense (3% of revenue). We removed $2 million related to non-operating income and $28 million related to non-operating expenses. See all the adjustments made to DATA’s income statement here.
Balance Sheet: we made $1.1 billion of adjustments to calculate invested capital with a net decrease of $454 million. The most notable adjustment was $326 million (38% of reported net assets) for operating leases. See all adjustments to DATA’s balance sheet here.
Valuation: we made $1.2 billion of adjustments with a net effect of increasing shareholder value by $193 million. The largest adjustment to shareholder value was $702 million in excess cash. This adjustment represents 17% of DATA’s market cap. Despite the increase in shareholder value, DATA remains significantly overvalued as detailed above.
Dangerous Funds That Hold DATA
The following funds receive our Dangerous-or-worse rating and allocate significantly to Tableau Software.
- Champlain Mid Cap Fund (CIPMX) – 1.2% allocation and Dangerous rating.
- Harbor Small Cap Growth Fund (HRSGX) – 1.0% allocation and Dangerous rating.
This article originally published here on March 6, 2017.
Disclosure: David Trainer, Kyle Guske II, and Kyle Martone receive no compensation to write about any specific stock, style, or theme.
Follow us on Twitter, Facebook, LinkedIn, and StockTwits for real-time alerts on all our research.
Scottrade clients get a Free Gold Membership ($588/yr value) as well as 50% discounts and up to 20 free trades ($140 value) for signing up to Platinum, Pro or Unlimited memberships. Login or open your Scottrade account & find us under Quotes & Research/Investor Tools.