
We’ve identified a mutual fund whose holdings fail to live up to its stated style and philosophy. Lord Abbett Growth Opportunities Fund (LMGAX) is in the Danger Zone.
Backward-Looking Research Overrates This Fund
Our fund research is forward looking, not backward looking. Our Predictive Fund Rating, which leverages our more reliable fundamental data proven to generate novel alpha, for LMGAX is Very Unattractive (equivalent to Morningstar’s 1 Star).
However, LMGAX, along with nine of its other classes (LMGCX, LGOQX, LGORX, LGOPX, LGOSX, LGOFX, LMGYX, LGOTX, and LGOVX), earns the 3 Star rating from Morningstar, while LOMGX earns the 4 Star rating. See Figure 1.
Figure 1: Lord Abbett Growth Opportunities Fund Ratings
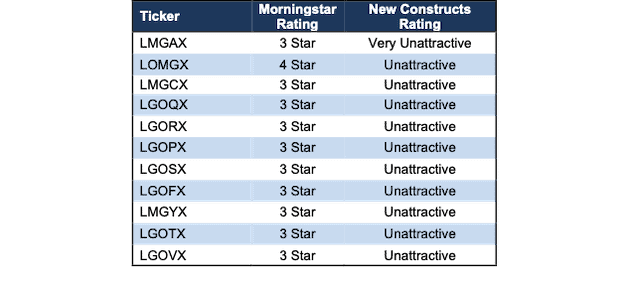
Sources: New Constructs, LLC, company, ETF and mutual fund filings, and Morningstar
Long on Words, but Short on Transparency
Lord Abbett Growth Opportunities Fund’s summary prospectus describes its style as,
“a growth style of investing that seeks to identify companies with strong relative growth prospects that are well positioned to benefit from the anticipated economic environment.”
Similarly vague, Lord Abbett Growth Opportunities Fund’s website notes its investment philosophy is,
“focused on identifying durable franchises that also exhibit a compelling combination of strong growth prospects and seasoned management teams that are mispriced by the market.”
These statements are short on details, rather subjective, and lack attention to any specific metrics to give investors a sense of how managers actually implement their investment strategy. Managers often use subjective or vague language to give them some wiggle room for how they pick stocks. Why wouldn’t managers want everyone to know how much work goes into building a quality portfolio? Why not be more transparent?
Regardless of the level of transparency, without the use of reliable fundamental data and metrics that accurately reflect profitability and valuation (e.g. Core Earnings[1], ROIC, and PEBV), LMGAX routinely invests in stocks with low-quality earnings and expensive valuations.
Holdings Research Reveals a Low-Quality Portfolio
LMGAX’s Very Unattractive rating means that its holdings have low profitability and expensive valuations. Our detailed holdings analysis, made possible by our Robo-Analyst technology[2], reveals that LMGAX has a much lower-quality portfolio compared to its benchmark, iShares Core S&P US Growth ETF (IUSG), which earns an Attractive rating.
Per Figure 2, LMGAX allocates 43% of its portfolio to Unattractive-or-worse rated stocks compared to just 14% for IUSG. On the flip side, LMGAX’s exposure to Attractive-or-better rated stocks is much lower, at 7%, versus IUSG at 30%.
Given the unfavorable allocation of Attractive-or-better rated stocks vs. Unattractive-or-worse rated stocks relative to the benchmark, LMGAX appears poorly positioned to generate the outperformance required to justify higher fees.
Figure 2: LMGAX Allocates Capital to More Low-Quality Holdings
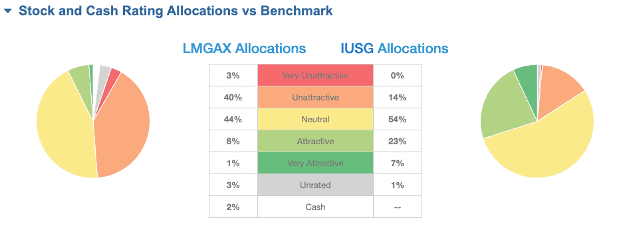
Sources: New Constructs, LLC and company, ETF and mutual fund filings
Expensive Stocks Drive Very Unattractive Risk/Reward Rating
Figure 3 contains our detailed rating for LMGAX, which includes each of the criteria we use to rate all funds under coverage. These criteria are the same for our Stock Rating Methodology, because the performance of a fund’s holdings equals the performance of a fund after fees.
Figure 3: Lord Abbett Growth Opportunities Fund Breakdown
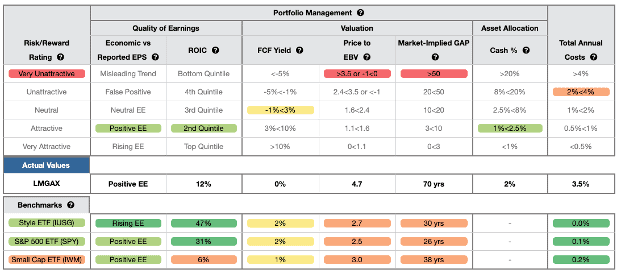
Sources: New Constructs, LLC and company, ETF and mutual fund filings
As Figure 3 shows, LMGAX is inferior to IUSG (click here for our report on IUSG) in all five criteria that make up our holdings/Portfolio Management analysis. More specifically:
- LMGAX’s economic earnings are positive, while IUSG’s economic earnings are positive and rising
- LMGAX’s ROIC is 12% and below the 47% earned by IUSG and 31% earned by SPY holdings
- LMGAX’s free cash flow (FCF) yield of 0% is lower than IUSG’s and SPY’s
- the price-to-economic book value (PEBV) ratio for LMGAX is 4.7, which is greater than the 2.7 for IUSG and 2.5 for SPY
- our discounted cash flow analysis reveals an average market implied growth appreciation period (GAP) of 70 years for LMGAX’s holdings compared to 30 years for IUSG and 26 years for SPY
In other words, the stocks LMGAX holds generate inferior cash flows and have higher valuations compared to both IUSG and SPY. The market expectations for stocks LMGAX holds imply profit growth (measured by PEBV ratio) that is well above the profit growth expectations embedded in IUSG’s and SPY’s holdings.
Low historical profits and high expectations for future profits are a bad combination.
Holdings Research Reveals Misleading Fund Style Classification
Investors that blindly trust fund managers without doing diligence on the fund’s holdings can unknowingly allocate to a different investment style than the fund’s name suggests. Prior research shows that managers drift into other styles to improve their relative ranking from Morningstar and look more attractive to investors.
Lord Abbett Growth Opportunities Fund may attract investors with its stated goal to (emphasis added), “deliver long-term growth of capital by investing primarily in stocks of mid-sized U.S. companies.” Morningstar classifies LMGAX as a Mid Cap Growth fund. Mid Cap is commonly defined as companies with market capitalizations between $2 and $10 billion.
Only 17 of LMGAX’s 94 holdings, which make up 12% of assets, have market caps that fall within the standard Mid Cap designation. Its top 10 holdings have market capitalizations ranging from $31 billion to $52 billion. Its smallest holding has a market cap of $1.7 billion. We believe LMGAX should be classified as an All Cap Growth fund to avoid misleading investors.
LMGAX Holds Danger Zone Stocks: Deep Dive on Lyft
LMGAX allocates to multiple Danger Zone stocks such as Lyft Inc. (LYFT), Snap Inc. (SNAP), Zendesk (ZEN), and Pinterest (PINS), which have expensive valuations despite generating little to no cash flows.
We put Lyft in the Danger Zone in March 2019 before its IPO and reiterated our opinion on the stock in May 2021.
Despite travel and transportation rebounding from COVID-19 lows, Lyft remains highly unprofitable. Its tenuous path to profitability (leveraging scale and autonomous driving to lower costs) isn’t looking any more likely either, just as with peers Uber (UBER) and Didi Global (DIDI).
When we look at the fundamentals of the business, economic earnings, which account for hidden and reported unusual gains and losses, have never been positive and declined from -$908 million in 2017 to -$1.7 billion over the trailing twelve months (TTM). Lyft has burned through $5.4 billion (30% of market cap) in FCF over the past three years, and FCF sits at -$575 million over the TTM period.
Current Price Implies 90% of 2030 Global Total Addressable Market (TAM): Given a continued lack of profitability and recent rulings classifying drivers as employees (which will increase labor costs), we think Lyft shares remain priced beyond perfection. Below, we use our reverse discounted cash flow (DCF) model to analyze the future cash flow expectations baked into Lyft’s stock price and provide clear mathematical evidence that the current valuation implies Lyft will take 90% of the global TAM.
To justify its current price of $52/share, Lyft must immediately:
- improve its pre-tax margin to 4% (compared to -63% TTM), which is similar to airlines prior to consolidation, from 2021 through 2030 and
- grow revenue by 38% compounded annually for the next 10 years.
In this scenario, Lyft would earn $59 billion in revenue in 2030, which is 24x its TTM revenue and over 16x its 2019, or pre-COVID revenue. If we assume a take rate[3] of 19%, this scenario equates to nearly $309 billon spent on Lyft’s platform in 2030.
In other words, to justify its current stock price, Lyft must capture 90% of the projected global TAM for ridesharing in 2030. For reference, Second Measure estimates Lyft’s U.S. market share is 32% as of August 2021.
There’s 63%+ Downside If Consensus Is Right: If we instead assume:
- pre-tax margin immediately improves to 4% from 2021 through 2030 and
- revenue grows by consensus estimates from 2021-2023
- revenue grows 22% (continuation of 2023 consensus estimate) a year from 2024-2030 then
the stock is worth just $19/share today – a 63% downside to the current price. See the math behind this reverse DCF scenario. Should Lyft fail to achieve such high pre-tax margins, or miss consensus revenue growth estimates, the downside is even larger.
Figure 4 charts Lyft’s historical and implied revenue in each of the above scenarios, along with Uber’s 2020 and TTM revenue for reference.
Figure 4: Lyft’s Historical and Implied Revenue: DCF Valuation Scenarios
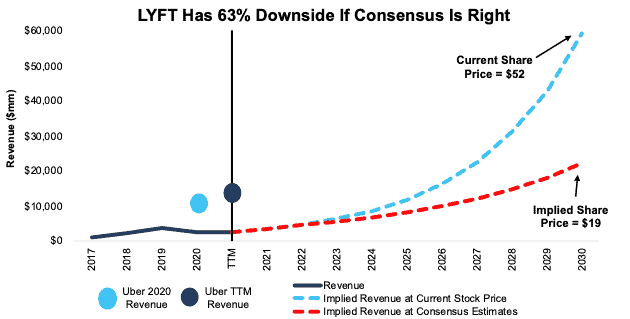
Sources: New Constructs, LLC and company filings.
Each of the above scenarios also assumes Lyft is able to grow revenue, NOPAT, and FCF without increasing working capital or fixed assets. This assumption is highly unlikely but allows us to create best-case scenarios that demonstrate how high the expectations embedded in the current valuation are.
Overpriced and Overhyped
At 3.50%, LMGAX’s total annual costs (TAC) are higher than 93% of the 461 All Cap Growth mutual funds under coverage. For comparison, the average TAC of all the All Cap Growth mutual funds under coverage is 1.66%, the asset-weighted average is 1.42%, and the benchmark ETF (IUSG) has total annual costs of just 0.04%.
Our TAC metric accounts for more than just the expense ratio. We consider the impact of front-end loads, back-end loads, redemption fees, and transaction costs. For example, LMGAX’s annual turnover ratio of 50% adds 0.11% to its total annual costs – which isn’t captured by the expense ratio. Figure 5 shows our breakdown of LMGAX’s total annual costs, which we provide for all of the ~6,000 mutual funds and 800+ ETFs under coverage.
Figure 5: Lord Abbett Growth Opportunities Fund’s Total Annual Costs Breakdown
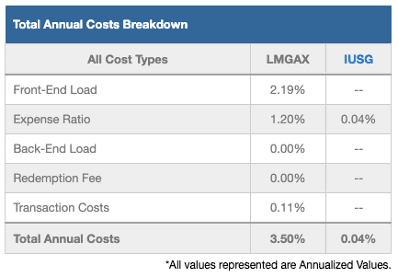
Sources: New Constructs, LLC and company, ETF and mutual fund filings
To justify its higher fees, LMGAX must outperform its benchmark by 3.46% annually over three years, the average holding period for all funds.
However, LMGAX’s load-adjusted three-year quarter-end average annual total return has underperformed IUSG by 128 basis points. Its load adjusted five-, and ten-year quarter-end average annual total returns have also underperformed IUSG by 320 and 263 basis points respectively.
Given that 43% of assets are allocated to stocks with Unattractive-or-worse ratings, and 87% are allocated to stocks with Neutral-or-worse ratings, LMGAX looks likely to continue to underperform.
Get a copy of our standard mutual fund report on LMGAX.
Easily Make Any Fund, Even LMGAX, Better
As we showed in The Paradigm Shift to Self-Directed Portfolio Construction, new technologies enable investors to create their own funds without any fees while also offering access to better, more sophisticated weighting methodologies. If for instance, investors wanted exposure to LMGAX’s holdings, but weighted by Core Earnings, the risk/reward of this customized version of the fund improves dramatically:
- 21% of assets to Attractive-or-better rated stocks (compared to 7% for LMGAX)
- 16% of assets to Unattractive-or-worse rated stocks (compared to 43% for LMGAX).
Compare the quality of stock allocation in our customized fund vs. LMGAX here. For research on smart beta strategies based on Earnings Distortion, click here.
Get an Edge from Holdings-Based Fund Analysis Based on Superior Stock Research
Smart fund (or ETF) investing means analyzing the holdings of each mutual fund. Failure to do so is a failure to perform proper due diligence. Simply buying a mutual fund or ETF based on past performance does not necessarily lead to outperformance. Only through holdings-based analysis can one determine if a fund’s methodology leads managers to pick high-quality or low-quality stocks.
Most investors don’t realize they can access sophisticated fundamental research[4] that enables them to overcome inaccuracies, omissions, and biases in legacy fundamental datasets. Our Robo-Analyst technology analyzes the holdings of all 487 ETFs and mutual funds in the All Cap Growth style and ~6,800 ETFs and mutual funds under coverage to avoid “the danger within.” Our diligence on holdings allows us to cut through the noise and identify potentially dangerous funds that traditional, backward-looking fund research may overlook, such as LMGAX.
Better Rated All Cap Growth Funds
Below we present five All Cap Growth ETFs or mutual funds that earn an Attractive-or-better rating, have more than $100 million in assets under management, and have below average TAC.
- Marshfield Concentrated Opportunity Fund (MRFOX) – Very Attractive rating and 1.17% TAC
- TrimTabs U.S. Free Cash Flow Quality ETF (TTAC) – Very Attractive rating and 0.65% TAC
- Fidelity Nasdaq Compositive Index ETF (ONEQ) – Attractive rating and 0.23% TAC
- Fidelity Momentum Factor ETF (FDMO) – Attractive rating and 0.32% TAC
- American Century STOXX U.S. Quality Growth ETF (QGRO) – Attractive rating and 0.32% TAC
Check out this week’s Danger Zone interview with Chuck Jaffe of Money Life.
This article originally published on October 18, 2021.
Disclosure: David Trainer, Kyle Guske II, Alex Sword, and Matt Shuler receive no compensation to write about any specific stock, sector, style, or theme.
Follow us on Twitter, Facebook, LinkedIn, and StockTwits for real-time alerts on all our research.
[1] Only Core Earnings enable investors to overcome the flaws in legacy fundamental data and research, as proven in Core Earnings: New Data & Evidence, a paper in The Journal of Financial Economics written by professors at Harvard Business School (HBS) & MIT Sloan.
[2] Harvard Business School features the powerful impact of our research automation technology in the case study New Constructs: Disrupting Fundamental Analysis with Robo-Analysts.
[3] Lyft doesn’t report its take rate, or the amount of each ride Lyft collects as revenue. For this scenario, we assume a similar take rate as Uber in 2020.
[4] See how our models overcome flaws in Bloomberg and Capital IQ’s (SPGI) analytics in the detailed appendix of this paper.