
We published an update on the Lyft Danger Zone pick on July 27, 2022. A copy of the associated report is here.
We published an update on the Spotify Danger Zone pick on May 23, 2021. A copy of the associated Earnings Update report is here.
We published an update on the Snap Danger Zone pick on August 3, 2021. A copy of the associated Earnings Update report is here.
We’re reiterating three Danger Zone picks that recently reported calendar 1Q21 earnings. Despite top line beats, these stocks remain highly overvalued. Lyft Inc. (LYFT: $50/share), Spotify (SPOT: $237/share) and Snap Inc. (SNAP: $53/share) are in the Danger Zone.
We leverage more reliable fundamental data, proven in The Journal of Financial Economics[1], with qualitative research to highlight these firms whose stocks present poor risk/reward.
Figure 1: Danger Zone Performance: Through 5/6/2021

Sources: New Constructs, LLC
*Measured from the opening price on each firm’s respective IPO/direct listing date since these Danger Zone reports were published prior to the IPO/direct listing and the stock had not begun trading. Performance represents price performance and is not adjusted for dividends.
**Measured from the date of publication of the original Danger Zone report. Date can be seen in the company section below. Performance represents price performance and is not adjusted for dividends.
Lyft Priced to Take 85% of Total Addressable Market (TAM)
We put Lyft in the Danger Zone in March 2019 prior to its IPO. The stock now trades well below its IPO price, but remains significantly overvalued post 1Q21 earnings.
What’s Working for the Firm: After achallenging 2020, Lyft’s business showed signs of recovery in 1Q21 as vaccination availability improves and consumers return to more normal activities. Revenue was up 7% quarter-over-quarter (QoQ) while active riders were up 8% QoQ and 55% from 2Q20, which was the lowest level during the COVID-19 lockdowns.
The firm’s adjusted EBITDA (which provides a misleading picture of the firm’s true losses) improved both QoQ and YoY but remains negative.
Going forward, management guided for 2Q21 revenues to increase 12-15% QoQ, which would also be >100% above 2Q20.
What’s Not Working for the Firm: Despite top-line growth, Lyft remains highly unprofitable, and it’s (unlikely) path to profitability (autonomous driving and/or lower labor costs) isn’t looking any more likely. In fact, costs look far more likely to rise, and we expect margins will get worse, not better.
Lyft agreed to sell its self-driving unit, Level 5, to Toyota subsidiary Woven Planet for $550 million. Lyft notes the sale will remove $100 million in “annualized non-GAAP operating expenses”, which is a rather small drop in the bucket considering Lyft’s Core Earnings[2] in 2020 were -$1.7 billion.
The sale of Level 5 also means Lyft is now dependent on outside firms to develop self-driving, which eliminates any competitive advantage Lyft might gained from owning that technology. If Alphabet’s (GOOGL) Waymo, General Motors’ (GM) Cruise, or another platform successfully develops self-driving, they could easily launch their own ride-hailing and delivery service rather than licensing the technology to the likes of Lyft and Uber.
The stubbornly low supply of drivers, the backbone of Lyft’s ridesharing network, continues to pressure costs higher for ridesharing and delivery businesses and has forced Lyft to offer higher incentives to entice drivers back to the platform. Gridwise, which helps delivery drivers maximize earnings on ridesharing platforms, notes that both Uber and Lyft are offering the largest driver incentives in years. Lyft expects low driver supply and attendant cost pressure will persist through 2Q21. The firm expects them to ease in 3Q21. Nevertheless, if incentives are only dropping a bit from their highest levels in year, we expect driver costs to continue to prevent Lyft from being profitable.
Lastly, another force that could drive costs even higher is a change in regulations that requires classifying rideshare drivers as employees instead of independent contractors. On May 5, 2021, President Biden’s administration blocked a rule that would have made it easier to classify drivers as independent contractors. Should the current administration look to expand worker protections, as is expected, Lyft, and Uber (UBER) or DoorDash (DASH) for that matter, could see labor costs get even higher.
Current Price Implies Lyft Owns 76% of TAM: Given its lack of profitability, no true competitive advantages, and regulatory risk, we think Lyft shares have gotten ahead of themselves rising over 90% over the past six months. When we use our reverse discounted cash flow (DCF) model to analyze the expectations implied by the stock price, LYFT appears significantly overvalued.
To justify its current price of $50/share, Lyft must immediately:
- improve its pre-tax margin to 4% (compared to -73% in 2020), which is similar to airlines prior to industry consolidation and
- grow revenue by 37% compounded annually for the next 10 years.
In this scenario, Lyft would earn over $55 billion in revenue in 2030, which is 23x its 2020 revenue and over 15x its 2019, or pre-COVID revenue. If we assume a take rate[3] of 19%, this scenario equates to nearly $287 billion spent on Lyft’s platform in 2030.
In other words, to justify its current stock price, Lyft must capture 76% of the projected TAM for rideshare in 2030.
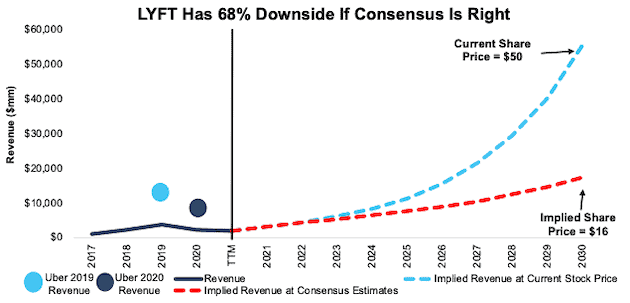
There’s 68%+ Downside: If we instead assume:
- pre-tax margin immediately improves to 4% from 2021 through 2030 and
- revenue grows by consensus estimates from 2021-2025 and
- revenue grows 18% a year from 2026-2030 (a continuation of 2025 estimates) then
the stock is worth just $16/share today – a 68% downside to the current price. See the math behind this reverse DCF scenario. Should Lyft fail to achieve such pre-tax margins, or miss consensus revenue growth estimates, the downside is even larger.
Figure 2 compares the firm’s historical revenue, revenue implied by its current stock price, and revenue implied by consensus estimates to illustrate just how high the expectations baked into Lyft’s stock price remain. For additional context, we also include Uber’s 2019 and 2020 revenue in Figure 2.
Figure 2: Lyft’s Historical and Implied Revenue: DCF Valuation Scenarios
Sources: New Constructs, LLC and company filings
Each of the above scenarios also assumes Lyft is able to grow revenue, NOPAT, and FCF without increasing working capital or fixed assets. This assumption is highly unlikely but allows us to create best-case scenarios that demonstrate how high the expectations embedded in the current valuation are. For reference, Lyft’s invested capital has grown by 2% compounded annually since 2017.
Spotify Priced to Own 77% of TAM
We first put Spotify in the Danger Zone in April 2018 prior to its IPO, again in September 2020, and highlighted the micro-bubble in its stock in March 2021. After 1Q21 earnings, the stock looks even more overvalued and remains in the Danger Zone.
What’s Working for the Firm: Spotify reported revenue was up 16% YoY in 1Q21 and monthly active users (MAUs) increased 24% YoY. The all-important premium subscribers (which made up 90% of revenue in 1Q21) grew 21% YoY to 158 million.
The firm reported 2.6 million podcasts on the platform, which was up from 2.2 million in 4Q20. During 1Q21, Spotify also upgraded its Desktop app and web player, increased the number of languages available on the platform, and improved its podcast search tool.
What’s Not Working for the Firm: Content costs, or in this case, podcast acquisition costs, will likely remain a drag on Spotify’s quest for profits, much like content costs have with Netflix. Spotify has spent over $1 billion over the past two years on podcasts with little to show for it in the way of faster user growth or bottom-line profits.
In 1Q21, revenue, MAUs, and premium subscribers all came in below consensus estimates. The firm’s YoY growth rate in premium subscribers declined to 21% in 1Q21 compared to 31% in 1Q20 and 32% in 1Q19.The company noted that the percentage of MAUs that engage with podcast content was consistent with 4Q20 levels, which were ~25% of users.
The percent of premium subscribers as a percent of MAUs was 44% in 1Q21, down from 45% in 1Q20 and 46% in 1Q19. In other words, Spotify is successfully adding users to its service, but it’s not converting them to premium subscribers as well as it has in the past. Going forward, Spotify cannot afford to get into bidding wars for content with tech giants such as Apple, with nearly $70 billion in cash and equivalents on its balance sheet.
However, Apple is squarely focused on outcompeting Spotify with the introduction of its premium podcast subscription. The new service will allow listeners ad-free listening and early access to episodes, which could increase Spotify’s customer acquisition costs and make it more difficult to acquire exclusive content if creators prefer Apple’s platform and monetization capabilities.
Current Price Implies Spotify Takes 77% of TAM: Below, we use our reverse DCF model to analyze the expectations for future growth in cash flows baked into SPOT’s current price.
To justify its current price of $237/share, Spotify must:
- immediately improve NOPAT margin to 8% (half of Sirius XM’s [SIRI] TTM margin, compared to Spotify’s -2% TTM margin) from 2021 through 2026 and
- grow revenue by 15% compounded annually (double projected industry growth through 2027) through 2026.
In this scenario, Spotify’s revenue six years from now would reach $22.4 billion, or 222% of its TTM revenue. The expectations for $22.4 billion in revenue in 2026 baked into Spotify’s share price imply its premium subscribers will more than double, from 158 million in 1Q21 to 348 million by 2026[4], which would equal 77% of the current global music streaming subscriptions. For reference, Counterpoint Research estimates Spotify held 34% of the global market in 2Q20, compared to 21% for Apple Music, 15% for Amazon Music, 12% for Tencent Music, and 5% for YouTube Music.
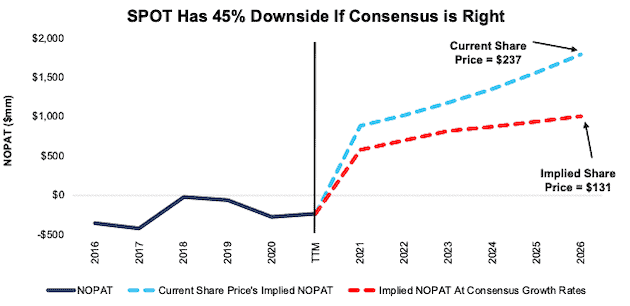
There’s 45%+ Downside: If we instead assume:
- NOPAT margin improves to 5% (equal to Amazon in 2020) from 2021 through 2026 and
- revenue grows by 19% compounded annually (consensus estimates) from 2021-2023 and
- revenue grows 7% a year from 2024-2026 (in-line with projected industry growth rates) then
the stock is worth just $131/share today – a 45% downside to the current price. See the math behind this reverse DCF scenario. If Spotify’s growth is slowed by competition, or it fails to improve its margins at such a rapid rate, the downside risk in owning shares is even higher.
Figure 3 compares the firm’s historical NOPAT, NOPAT implied by its current stock price, and NOPAT implied by consensus estimates to illustrate just how high the expectations baked into Spotify’s stock price remain.
Figure 3: Spotify’s Historical and Implied NOPAT: DCF Valuation Scenarios
Sources: New Constructs, LLC and company filings
Each of the above scenarios assumes Spotify’s YoY change in invested capital is 2% of revenue in each year of our DCF model. For context, Spotify’s change in invested capital has averaged 2% of revenue each year since 2017.
Snap Must Increase DAUs to 2x Facebook
We first put Snap in the Danger Zone in August 2018 and closed the position in February 2019. During which time the stock fell 65% (vs. S&P 500 +14%). We then put Snap back in the Danger Zone in September 2020. Below, we’ll show we what learned from 1Q21 earnings and why Snap still holds 78%+ downside risk.
What’s Working for the Firm: Snap’s “growth-story” is alive and well after 1Q21 earnings. The firm’s revenue grew 66% YoY and daily active users (DAUs) increased 51 million, or 22% YoY, which represent the highest YoY revenue and daily active user growth in 3+ years.
DAU growth was more robust in the Rest of World (+57%) and Europe (+9%) markets while North American DAUs grew 5% YoY. Average revenue per user(ARPU), while down QoQ, was up YoY, driven largely by improvements in the North American market.
Snap’s popularity with younger generations, such as millennials and gen Z, is also impressive. In 1Q21, Snap noted it reaches 90% of 13-24 year old’s and 75% of 13-34 year old’s in the United States, United Kingdom, Australia, France, and the Netherlands.
What’s Not Working for the Firm: Snap’s popularity with the 13-34 year old age groups is not a good thing for profits. This demographic has less spending power than older generations, and Snap is unable to turn a profit with them.
Given the saturation of more profitable markets (North America and Europe), Snap has to turn to International markets for future growth, where ARPU is even lower and falling. ARPU in Snap’s Rest of World market (its largest measured by DAUs) fell YoY for the fourth consecutive quarter in 1Q21. North American DAUs (Snap’s most profitable market by ARPU) grew at the slowest YoY rate in the past seven quarters.
More importantly for investors that care about fundamentals, Snap’s Core Earnings fell 5% YoY in 1Q21 and the firm’s ROIC remains highly negative at -20%. Free cash flow (FCF), when one accounts for the change in net working capital and fixed assets, remains negative at -$262 million in 1Q21 and -$1.8 billion over the TTM period.
We do not see how Snap will ever be profitable given the competitive advantages of its primary competitors and its inability to differentiate to date. New ideas are commoditized in almost real-time because Facebook (FB), Instagram, Twitter (TWTR), TikTok and more have deep pockets and can see whatever Snap does as soon as it does it. As Wired Magazine wrote:
“Which major platform has a news feed, disappearing posts, private messaging, and a live broadcasting feature? That would be … all of them.”
Current Price Implies DAUs Reach 211% of Facebook’s DAUs: Below, we use our reverse DCF model to analyze the expectations for future growth in cash flows baked into SNAP’s current price.
To justify its current price of $53/share, Snap must:
- immediately improve NOPAT margin to 16% (which equals Twitter’s best ever margin in 2018, compared to Snap’s -31% TTM margin) and
- grow revenue by 33% compounded annually (double projected industry growth through 2027) through 2030.
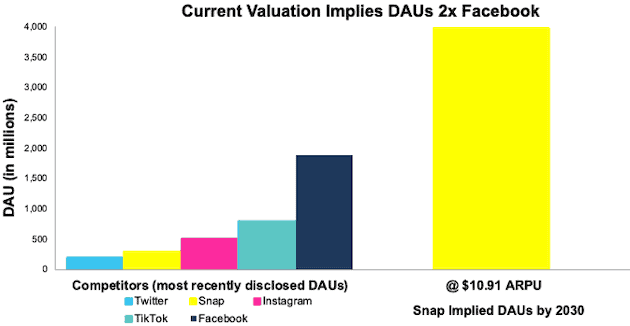
In this scenario, Snap would generate over $43 billion in revenue ten years from now, which is 15x its TTM revenue and 11x Twitter’s TTM revenue. At its annual ARPU[5], $10.91 at the end of 1Q21, this scenario implies the firm would have over 3.9 billion DAUs, which is 50% of the global population and 211% of Facebook’s DAUs at the end of 1Q21.
For comparison, if we optimistically assume Snap can immediately double its ARPU to $21.82, then Snap needs just under 2.0 billion DAUs to achieve the revenue implied by its stock price. In other words, even if Snap can double ARPU, it must have 106% the DAUs (in ten years) as Facebook in 1Q21 and grow DAUs by 710% to justify its current stock price. See Figure 4.
Figure 4: Snap’s Implied DAUs vs. Its Competition
Sources: New Constructs, LLC and company filings
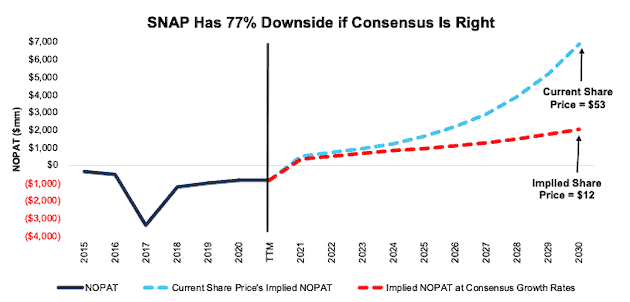
There’s 77%+ Downside: If we instead assume:
- NOPAT margin improves to 8% (equal to Twitter’s 3-year average margin) from 2021 through 2030 and
- revenue grows by 49% compounded annually (consensus estimates) from 2021-2023 and
- revenue grows 17% a year from 2024-2030 (in-line with projected industry growth rates through 2027) then
the stock is worth just $12/share today – an 80% downside to the current price. See the math behind this reverse DCF scenario. If Snap’s growth falters, due to competition continually copying features, or an entirely new platform taking users, or it fails to improve profitability at such a quick pace, the downside risk in owning shares is even higher.
Figure 5 compares the firm’s historical NOPAT, NOPAT implied by its current stock price, and NOPAT implied by consensus estimates to illustrate just how high the expectations baked into Snap’s stock price remain.
Figure 5: Snap’s Historical and Implied NOPAT: DCF Valuation Scenarios
Sources: New Constructs, LLC and company filings
Each of the above scenarios assumes Snap’s YoY change in invested capital is 10% of revenue in each year of our DCF model. For context, Snap’s invested capital has grown 36% compounded annually since 2015 and change in invested capital has averaged 10% of revenue over the past three years.
Other Danger Zone Picks That Recently Reported Earnings
Figure 6 shows five other Danger Zone picks that have recently reported their calendar 1Q21 earnings along with their relative performance to the S&P 500.
Figure 6: More Danger Zone Picks That Recently Reported Earnings: Through 5/6/2021
| Company | Ticker | Date Published | Earnings Date | Out (under)performance as Short vs. S&P 500* |
| Uber Technologies | UBER | 4/22/19 | 5/5/21 | 33% |
| GoDaddy Inc. | GDDY | 4/16/18 | 5/5/21 | 26% |
| Tesla Inc. | TSLA | 12/14/20 | 4/26/21 | 11% |
| Shopify Inc. | SHOP | 9/10/20 | 4/28/21 | 9% |
| Netflix Inc. | NFLX | 8/12/19 | 4/20/21 | (15%) |
Sources: New Constructs, LLC
* Measured from the date of publication of each respective report. Performance represents price performance and is not adjusted for dividends.
Check out this week’s Danger Zone interview with Chuck Jaffe of Money Life.
This article originally published on May 10, 2021.
Disclosure: David Trainer, Kyle Guske II, and Matt Shuler receive no compensation to write about any specific stock, sector, style, or theme.
Follow us on Twitter, Facebook, LinkedIn, and StockTwits for real-time alerts on all our research.
[1] Our reports utilize our Core Earnings, a more reliable measure of profits, as demonstrated in Core Earnings: New Data & Evidence, a paper by professors at Harvard Business School (HBS) & MIT Sloan. Recently accepted by the Journal of Financial Economics, the paper proves that our data is superior to all the metrics offered elsewhere.
[2] Only Core Earnings enable investors to overcome the errors, omissions and biases in legacy fundamental research, as proven in Core Earnings: New Data & Evidence, forthcoming in The Journal of Financial Economics.
[3] Lyft doesn’t report its take rate, or the amount of each ride Lyft collects as revenue. For this scenario, we assume a similar take rate as Uber in 2020.
[4] We calculate the implied number of premium subscribers by dividing implied premium revenue of $20.2 billion (or 90% of implied total revenue) by $58, which equals Spotify’s TTM revenue per premium user ( TTM premium revenue divided by premium users at the end of 1Q21).
[5] Calculated as TTM revenue of $2.8 billion divided by average quarterly DAUs over the TTM (258 million).