
Check out this week’s Danger Zone interview with Chuck Jaffe of Money Life.
Despite its 3 Star Morningstar rating, Virtus Zevenbergen Innovative Growth Stock Fund (SAGAX) is one of the worst rated funds in our 8,000+ ETF and mutual fund coverage universe. SAGAX is in the Danger Zone.
Virtus Zevenbergen Innovative Growth Stock Fund (SAGAX) is in the All Cap Growth style, which ranks seventh per our 4Q19 Style Ratings for ETFs and Mutual Funds report and earns our Neutral rating. There are 79 Attractive-or-better rated funds in the style, but there are also over 100 Unattractive-or-worse funds. As such, investors need to be careful to avoid the risky funds in this sector.
SAGAX gets our Very Unattractive Rating, the worst of Predictive Risk/Reward Fund ratings, which are based on analysis of fund holdings and leverage the Earnings Distortion research featured in this Harvard Business School and MIT Sloan paper.
Backwards Looking Research Overrates this Fund
Per Figure 1, SAGAX and SCATX earn the 3-Star rating from Morningstar. However, our Predictive Risk/Reward Fund Rating methodology shows them as Very Unattractive.
Figure 1: Virtus Zevenbergen Innovative Growth Stock Fund Ratings

Sources: New Constructs, LLC, company, ETF and mutual fund filings, and Morningstar
SAGAX allocates significant capital to companies with low profitability and high profit growth expectations baked into their stock prices, which makes its portfolio unusually risky. Investors that rely solely on past performance may not see the true risk of investing in this fund.
Holdings Research Reveals a Low-Quality Portfolio Versus the Benchmark
The only justification for a mutual fund to charge higher fees than its ETF benchmark is “active” management that leads to out-performance. A fund is most likely to outperform if it has higher quality holdings than its benchmark. To assess holdings quality, we leverage our Robo-Analyst technology[1] to drill down and analyze the individual stocks in every fund we cover.
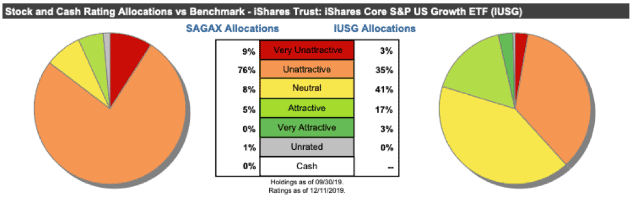
Per Figure 2, Virtus Zevenbergen Innovative Growth Stock Fund’s asset allocation poses greater downside risk and holds less upside potential than its benchmark, the iShares Core S&P U.S. Growth ETF (IUSG).
SAGAX allocates just 5% of its portfolio to Attractive-or-better rated stocks compared to 20% for IUSG. On the flip side, SAGAX’s exposure to Unattractive-or-worse rated stocks is much higher, at 85% versus IUSG at 38%.
Figure 2: SAGAX Allocates Capital to More Low-Quality Holdings
Sources: New Constructs, LLC and company, ETF and mutual fund filings
Given the unfavorable allocation of Very Attractive vs. Very Unattractive stocks relative to the benchmark, SAGAX appears poorly positioned to generate the outperformance required to justify its fees.
Stock Selection Methodology Picks Bad Stocks
Virtus Zevenbergen Innovative Growth Stock Fund claims its investment process includes three key items:
- High growth focus
- Rigorous fundamental research
- High-Conviction portfolio
SAGAX’s portfolio certainly finds stocks with high-growth expectations, as we’ll show below. “Rigorous fundamental research,” as SAGAX defines it, aims to identify stocks with “price catalysts from positive revenue, cash flow, and earnings growth.” That statement looks good on its face, but the fund provides no details on exactly how it measures “cash flow” and “earnings growth”, two metrics that are prone to manipulation by corporate managers.
As we show in “Consensus Earnings Are Wrong & How Much Is It Costing You”, earnings are misunderstood by the market. Core earnings, when adjusted for unusual gains/losses, are falling much faster than reported earnings. Further, reported earnings are easily manipulated through the use of numerous accounting loopholes; so, not surprisingly, earnings growth has very little correlation with shareholder value creation.
As empirically shown in “Core Earnings: New Data & Evidence”, our models remove these distortions to calculate a better measure of earnings and, subsequently, valuation of SAGAX’s holdings. Our research finds that it allocates to stocks with significantly lower profitability but higher expectations for future profit growth than its benchmark and the market as a whole.
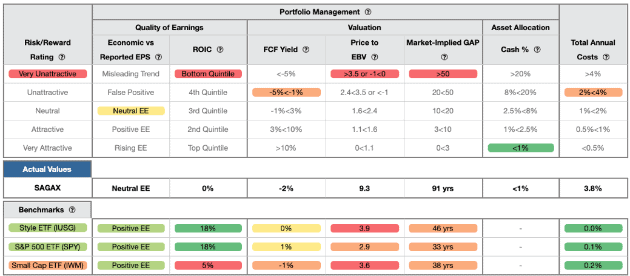
Figure 3 contains our detailed rating for SAGAX, which includes each of the criteria we use to rate all funds under coverage. These criteria are the same for our Stock Rating Methodology because the performance of a fund’s holdings equals the performance of a fund after fees.
Figure 3: Virtus Zevenbergen Innovative Growth Stock Fund Rating Breakdown
Sources: New Constructs, LLC and company, ETF and mutual fund filings
As Figure 3 shows, SAGAX’s holdings are inferior to its benchmark, IUSG, in all five of criteria that make up our holdings analysis. Specifically:
- SAGAX’s return on invested capital (ROIC) is 0% and well below the 18% earned by IUSG and the S&P 500 (SPY).
- SAGAX’s free cash flow yield of -2% is worse than the 0% of IUSG and 1% of SPY.
- The price to economic book value (PEBV) ratio for SAGAX is 9.3, which is significantly greater than the 3.9 for IUSG holdings and the 2.9 of SPY holdings.
- Our discounted cash flow analysis reveals an average market implied growth appreciation period (GAP) of 91 years for SAGAX’s holdings compared to 46 years for IUSG and 33 years for SPY.
The stocks held by SAGAX generate inferior cash flows and have higher valuations compared to IUSG. The market expectations for stocks held by SAGAX imply cash flow growth that is more than double the cash flow expectations embedded in IUSG’s holdings. Lower historical profits and higher expectations for future profits are a bad combination.
Overweighting Technology Adds Earnings Distortion Risk
45% of the fund is in the Technology sector.
As we show in, “Big Tech Leads Decline in Core Earnings,” the Technology sector’s earnings distortion worsened more than any other sector over the trailing twelve months. Reported earnings have not been this overstated, relative to core earnings, for the Tech sector since the Tech bubble.
In other words, by investing heavily in the Technology sector, SAGAX is allocating to stocks with some of the most overstated earnings in the market. These stocks are more likely to miss earnings expectations, which could lead to significant underperformance moving forward.
Deep Dive on SAGAX’s Bad Stock Holdings
SAGAX’s holdings include many previous Danger Zone picks including Netflix (NFLX), Tesla (TSLA), Shake Shack (SHAK), Uber (UBER), Zillow (ZG), CoStar Group (CSGP), and ServiceNow (NOW).
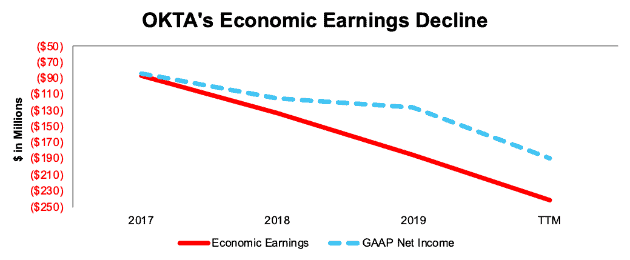
Okta Inc. (OKTA: $118/share) is one of SAGAX’s worst holdings, due to its rising earnings distortion, worsening cash flows, and overvalued stock price. OKTA’s GAAP net income has fallen 127%, from -$83 million in 2017 to -$189 million TTM. Core earnings, which account for non-operating items buried in the footnotes, have fallen 139%, from -$83 million to -$198 million over the same time.
Economic earnings, which not only account for non-operating items on the income statement, but also changes to the balance sheet, look even worse. Economic earnings have declined 179%, from -$87 million in 2017 to -$241 million TTM. See Figure 4.
Figure 4: OKTA’s Economic Earnings vs. GAAP Earnings Since 2017
Sources: New Constructs, LLC and company filings
OKTA’s positive earnings distortion (i.e. overstated earnings) is due to non-recurring gains that artificially prop up reported earnings. For example, the company reported over $11 million in other income through the nine months ended October 31, 2019. This other income is attributable to interest earnings on short-term investment balances and not the core operations of the business.
OKTA is Significantly Overvalued
Despite the deterioration in the core earnings of the company, shares have increased ~69% over the past year and are quite overvalued. We use our reverse DCF model to quantify the growth in cash flows OKTA must achieve to justify its valuation.
To justify its current price of $118/share, OKTA must immediately achieve 13% NOPAT margins (average of 61 Software firms under coverage with positive NOPAT margin – compared to -30% TTM) and also grow revenue by 34% compounded annually for the next 14 years. See the math behind this reverse DCF scenario. In this scenario, OKTA would be generating $24 billion in revenue 14 years from now, which today would rank behind only Microsoft and Oracle in terms of annual revenue, out of the 117 Software firms under coverage.
Even if we assume OKTA can achieve 15% NOPAT margins, and grow revenue by 30% compounded annually for the next decade, the stock is worth only $26/share today – a 78% downside. See the math behind this reverse DCF scenario.
Excessive Fees Make Outperformance Even More Difficult
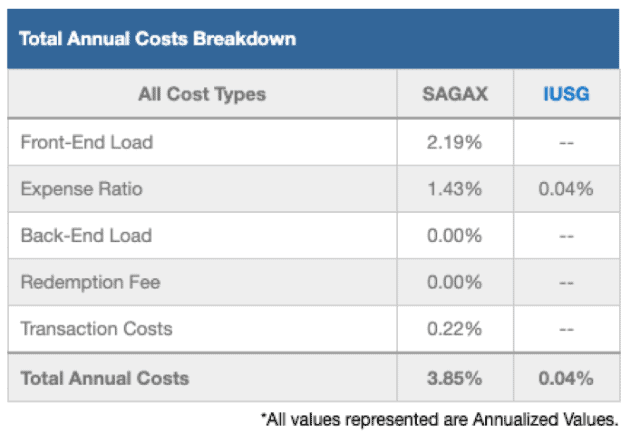
At 3.85%, SAGAX’s total annual costs (TAC) are higher than 97% of the 560 All Cap Growth mutual funds under coverage. For comparison, the average TAC of all All Cap Growth mutual funds under coverage is 1.75%, the weighted average is 1.56%, and the benchmark ETF (IUSG) has total annual costs of 0.04%.
Our TAC metric accounts for more than just expense ratios. We consider the impact of front-end loads, back-end loads, redemption fees, and transaction costs. For example, SAGAX’s front-end load adds 2.19% to its total annual costs and its annual turnover ratio of 103% adds 0.22% to its total annual costs – neither of which are captured by the expense ratio. Figure 5 shows our breakdown of SAGAX’s total annual costs, which is available for all of the 8,000+ mutual funds under coverage.
Figure 5: Virtus Zevenbergen Innovative Growth Stocks Fund Total Annual Costs Breakdown
Sources: New Constructs, LLC and company, ETF and mutual fund filings
To justify its higher fees, each class of the fund must outperform its benchmark by the following over three years:
- SAGAX must outperform by an average of 3.80% annually.
- SCATX must outperform by an average of 1.30% annually.
An in-depth analysis of SAGAX and its TAC is available in our standard mutual fund report.
SAGAX’s Performance Can’t Justify Its Fees
When we take into account its load, which adds 2.19% to its total annual costs, we see that SAGAX has underperformed in recent years and failed to justify its fees.
SAGAX’s 1-year quarter-end average annual total return underperformed IUSG by over 16 percentage points. Its 3-year quarter-end average annual total return bested IUSG by 152 basis points, which is nowhere near enough to justify its fees, as noted above. Its 5 and 10-year quarter-end average annual total return each underperformed by 167 and 85 basis points respectively
Given that 85% of assets are allocated to stocks with Unattractive-or-worse ratings, SAGAX looks likely to underperform moving forward.
The Importance of Holdings-Based Fund Analysis
Smart fund (or ETF) investing means analyzing the holdings of each mutual fund. Failure to do so is a failure to perform proper due diligence. Simply buying a mutual fund or ETF based on past performance does not necessarily lead to outperformance. Only through holdings-based analysis can one determine if a fund’s methodology leads managers to pick high-quality or low-quality stocks.
However, most investors don’t realize they can access sophisticated fundamental research using data that corrects market inefficiencies and generates alpha. Our Robo-Analyst technology analyzes the holdings of all 586 ETFs and mutual funds in the All Cap Growth style and 8,000+ ETFs and mutual funds under coverage to avoid “the danger within.[2]” This diligence allows us to cut through the noise and identify potentially dangerous funds that traditional backward-looking fund research may overlook, such as SAGAX.
Better Rated All Cap Growth Funds
The following All Cap Growth mutual funds earn an Attractive-or-better rating, have more than $100 million in assets under management, and have lower TAC than SAGAX.
- RiverPark Funds: RiverPark/Wedgewood Fund (RWGIX) – Very Attractive – 1.08% TAC
- YCG Enhanced Fund (YCGEX) – Attractive – 1.37% TAC
- Hennessy Focus Fund (HFCSX) – Attractive – 1.68% TAC
This article originally published on December 16, 2019.
Disclosure: David Trainer, Kyle Guske II, and Sam McBride receive no compensation to write about any specific stock, sector, style, or theme.
Follow us on Twitter, Facebook, LinkedIn, and StockTwits for real-time alerts on all our research.
[1] Harvard Business School features the powerful impact of our research automation technology in the case study New Constructs: Disrupting Fundamental Analysis with Robo-Analysts.
[2] This paper compares our analytics on a mega cap company to other major providers.