
Three new stocks make April’s Exec Comp Aligned with ROIC Model Portfolio, available to members as of April 15, 2020.
Recap from March’s Picks
Our Exec Comp Aligned with ROIC Model Portfolio (-1.4%) underperformed the S&P 500 (+2.4%) by 3.8% from March 13, 2020 through April 13, 2020. The best performing stock in the portfolio was up 12%. Overall, four out of the 15 Exec Comp Aligned with ROIC Stocks outperformed the S&P from March 13, 2020 through April 13, 2020.
Only our research utilizes the superior data and earnings adjustments featured by the HBS & MIT Sloan paper,"Core Earnings: New Data and Evidence.” The success of this Model Portfolio highlights the value of our Robo-Analyst technology[1], which scales our forensic accounting expertise (featured in Barron’s) across thousands of stocks.
This Model Portfolio only includes stocks that earn an Attractive or Very Attractive rating and align executive compensation with improving ROIC. We think this combination provides a uniquely well-screened list of long ideas because return on invested capital (ROIC) is the primary driver of shareholder value creation.[2]
New Stock Feature for March: Target Corporation (TGT: $113/share)
Target Corporation (TGT) is the featured stock in April’s Exec Comp Aligned with ROIC Model Portfolio.
We first made TGT a Long Idea in April 2015 and closed the position in May 2018. We once again made it a Long Idea in June 2019 and reiterated the position in August 2019 and January 2020. Since the June 2019 report, the stock has outperformed the S&P 500 (up 33% vs S&P up 2%), and remains undervalued.
TGT has grown revenue and after-tax profit (NOPAT) by 2% compounded annually over the past decade. TGT’s NOPAT margin increased from 4.6% in 2010 to 4.7% in 2020, while its invested capital turns improved from 2.0 to 2.4 over the same time. Improvements in both NOPAT margin and invested capital turns drive TGT’s ROIC from 9% in 2010 to 11% in 2020.
Figure 1: TGT’s Revenue & NOPAT Since 2017
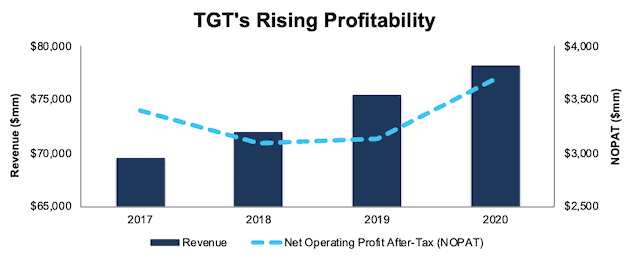
Sources: New Constructs, LLC and company filings
Compensation Plan Properly Incentivizes Executives
41% to 43% (depending on position) of TGT executives’ compensation consists of performance-based restricted share units (RSU’s). These RSU’s are awarded based on the three-year performance of ROIC, adjusted sales growth and EPS growth relative to TGT’s retail peer group.
TGT’s focus on ROIC helps ensure intelligent capital allocation that helps create shareholder value. TGT first included ROIC in its executive compensation plan in 2014 and has increased ROIC year-over-year (YoY) in five of the six years since then. Per Figure 2, ROIC improved from 7% in 2014 to 11% in 2020.
Figure 2: TGT’s ROIC Since 2014
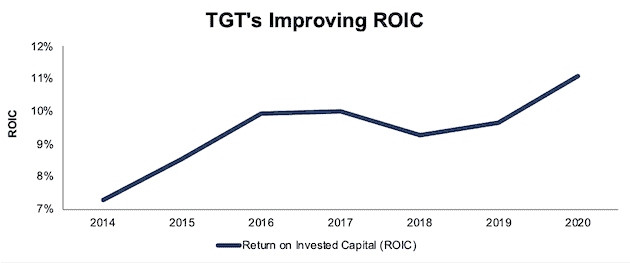
Sources: New Constructs, LLC and company filings
TGT’s Valuation Offers Upside Potential
At its current price of $113/share, TGT has a price-to-economic book value (PEBV) ratio of 1.0. This ratio means the market expects TGT’s NOPAT to never meaningfully grow from current levels. This expectation seems overly pessimistic for a firm that has grown NOPAT by 3% compounded annually for the past five years and 5% compounded annually over the past two decades. Furthermore, TGT recently reported that it was experiencing unusually strong traffic and sales as guests rely on the firm for essential items during the COVID-19 pandemic.
If TGT can maintain its fiscal 2020 NOPAT margin (5%) and grow NOPAT by just 3% compounded annually for the next decade, the stock is worth $149/share today – a 32% upside. See the math behind this reverse DCF scenario.
Critical Details Found in Financial Filings by Our Robo-Analyst Technology
As investors focus more on fundamental research, research automation technology is needed to analyze all the critical financial details in financial filings as shown in the Harvard Business School and MIT Sloan paper, "Core Earnings: New Data and Evidence”.
Below are specifics on the adjustments we make based on Robo-Analyst findings in Target’s 2020 10-K:
Income Statement: we made $832 million of adjustments, with a net effect of removing $406 million in non-operating expenses (1% of revenue). You can see all the adjustments made to TGT’s income statement here.
Balance Sheet: we made $10.3 billion of adjustments to calculate invested capital with a net increase of $6.8 billion. One of the largest adjustments was $4.0 billion in asset write-downs. This adjustment represented 14% of reported net assets. You can see all the adjustments made to TGT’s balance sheet here.
Valuation: we made $17.6 billion of adjustments with a net effect of decreasing shareholder value by $17.6 billion. There were no adjustments that increased shareholder value. Apart from total debt, one of the largest adjustments to shareholder value was $1.1 billion in net deferred tax liability. This adjustment represents 2% of TGT’s market cap. See all adjustments to TGT’s valuation here. Despite these subtractions from shareholder value, TGT remains undervalued.
This article originally published on April 21, 2020.
Disclosure: David Trainer, Kyle Guske II, and Matt Shuler receive no compensation to write about any specific stock, style, or theme.
Follow us on Twitter, Facebook, LinkedIn, and StockTwits for real-time alerts on all our research.
[1] Harvard Business School features the powerful impact of our research automation technology in the case New Constructs: Disrupting Fundamental Analysis with Robo-Analysts.
[2] This paper compares our analytics on a mega cap company to Bloomberg and Capital IQ (SPGI) in a detailed appendix.