We published an update on AZO on May 26, 2021. A copy of the associated Earnings Update report is here.
In sinking markets, strong ROICs are the only life rafts. As we’ve shown before, stocks for companies with higher ROICs performed the best during and after the financial crisis.
Nearly all stocks suffer in a bear market, but those with high ROICs tend to suffer less and rise faster in the recovery. If you want more confidence in your portfolio, then own companies with high ROICs.
Our Robo-Analyst[1] recently highlighted these companies with strong ROICs, growing profits, and undervalued stock prices: AutoZone (AZO: $1,148/share), SYSCO Corporation (SYY: $62/share), Best Buy (BBY: $70/share), NVR Inc. (NVR: $3,750/share), and Omnicom Group (OMC: $64/share). We focus on AutoZone (AZO) and Best Buy (BBY) as this week’s Long Ideas.
Using ROIC to Find Value
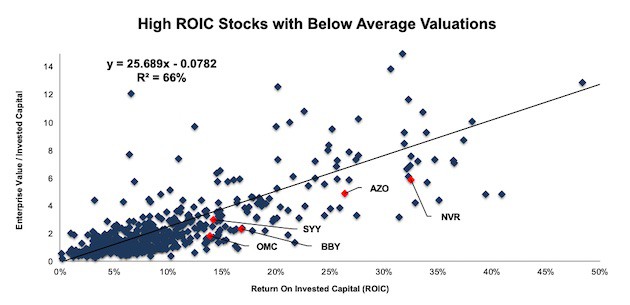
We’ve long argued (and proven empirically) that there is a strong correlation between improving ROIC and increasing shareholder value. We’ve also shown, the winners, both during and after a market crash, tend to be companies that earn a high ROIC. Figure 1 shows that changes in ROIC explain 66% of the changes in enterprise value divided by invested capital (a cleaner version of price-to-book) for the S&P 500. It also highlights five stocks trading well below their fair value based on ROIC.
Figure 1: Five Undervalued S&P 500 Stocks
Sources: New Constructs, LLC and company filings.
These five stocks are not only undervalued relative to the S&P 500, the underlying businesses are strong:
- All firms have positive and rising core earnings and economic earnings
- All firms have increased their ROIC year-over-year in the most recent period
- All firms have earned positive economic earnings in each of the past 10 years
- All stocks earn our Very Attractive rating
Investors looking for long-term value creating stocks in this volatile market should start here.
AutoZone (AZO) – Very Attractive Rating
We first made AutoZone a Long Idea in February 2014, and reiterated the stock in November 2018. Since our original report the stock is up 101% (S&P 500 +51%) and since our 2018 report the stock is up 37% (S&P 500 -1%). Despite this outperformance, shares still trade at a significant discount and represent quality risk/reward.
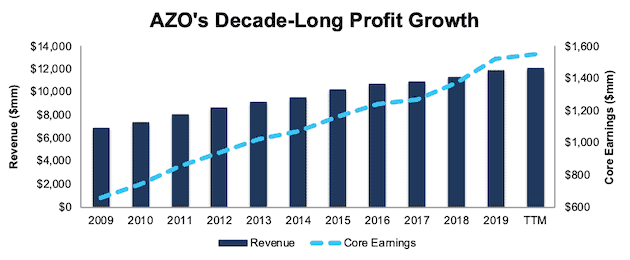
Over the past decade, AZO has grown revenue by 6% compounded annually and core earnings by 9% compounded annually, per Figure 2. The firm has increased its core earnings margin year-over-year (YoY) in nine of the past 10 years and its TTM core earnings margin of 13% is up from 10% in 2009. AZO has improved its ROIC from 19% in 2009 to a top-quintile 26% TTM and has generated $5.9 billion (22% of market cap) in cumulative free cash flow over the past five years.
Figure 2: AZO’s Revenue & Core Earnings Since 2009
Sources: New Constructs, LLC and company filings
Economic Earnings Are Also Improving
Core earnings account for unusual gains and expenses included in GAAP net income. To get the full picture of a company’s operations and hold management accountable for capital allocation, we also analyze balance sheets to calculate an accurate ROIC and economic earnings.
Some notable adjustments to AZO’s balance sheet include:
- Added $1.8 billion in operating leases
- Added $250 million in other comprehensive loss
- Added $227 million in accumulated asset write-downs
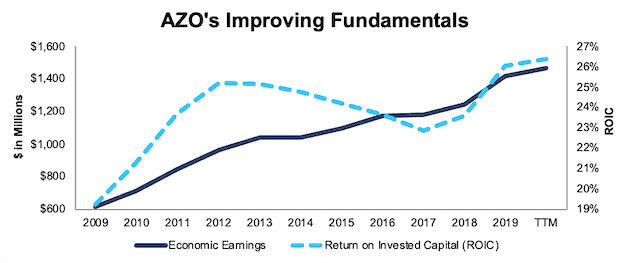
After all adjustments, we find that AZO’s economic earnings grew 9% compounded annually over the past decade, per Figure 3. AZO’s economic earnings have grown 14% compounded annually over the past two decades.
Figure 3: AZO’s Economic Earnings & ROIC Since 2009
Sources: New Constructs, LLC and company filings
Leading ROIC Amongst Competitors
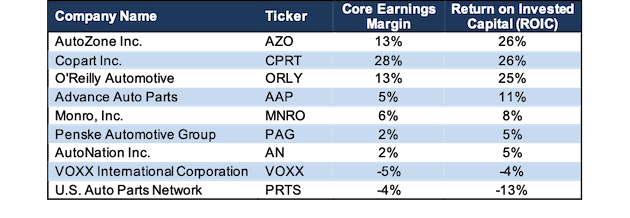
AutoZone has leveraged its nationwide store base and distribution network to maintain competitive advantages over peers. Per Figure 4, AZO’s ROIC ranks first among the publicly traded automotive parts retailers under coverage and its core earnings margin ranks second.
Figure 4: AZO’s ROIC & Profitability Leads Competition
Sources: New Constructs, LLC and company filings
Shares Look Significantly Undervalued
At its current price of $1,148/share, AZO has a price-to-economic book value (PEBV) ratio of 0.8. This ratio means the market expects AZO’s NOPAT to permanently decline by 20%. This expectation seems overly pessimistic for a firm that has grown NOPAT by 8% compounded annually over the past decade and 10% compounded annually over the past two decades.
If AZO traded at the level implied by the trend line in Figure 1, it would be worth ~$1,573/share today, 37% above its current price. AZO’s current price implies that its ROIC will permanently decline to ~19%, a level not seen since 2009.
When we analyze the cash flow expectations baked into the stock price using our reverse DCF model, we also find that AZO is significantly undervalued.
If AZO can simply maintain its 2019 NOPAT margin (15%) and grow NOPAT by 4% compounded annually (in-line with projected industry growth) for the next decade, the stock is worth $1,970/share today – 72% above its current price. See the math behind this reverse DCF scenario.
Compensation Plan Properly Incentivizes Executives
In our original report in 2014, we pointed out AZO’s superior executive compensation plan. AutoZone added return on invested capital to its executive compensation plan in 2002 and quality corporate governance remains in place today. In fiscal 2019, executives’ total cash incentive award was determined based on the impact of ROIC and EBIT on AutoZone’s economic profit.
As noted in its proxy statement, AZO’s compensation committee believes ROIC is an important factor in enhancing stockholder value. We agree. AZO’s executive compensation plan lowers the risk of investing in this company because we know its executives are incentivized to create true shareholder value.
This compensation plan, along with strong fundamentals, earned AZO a spot in February’s Exec Comp Aligned with ROIC Model Portfolio.
Best Buy (BBY) – Very Attractive Rating
Best Buy Co, Inc. (BBY) was recently upgraded to Very Attractive (from Attractive) on February 28, 2020. We first made BBY a Long Idea in April 2018 and reiterated the stock in November 2018. BBY has underperformed since our reports, which we think is due to the overblown “retail apocalypse” narrative. However, the stock remains undervalued and any additional drop in its price presents an even better buying opportunity.
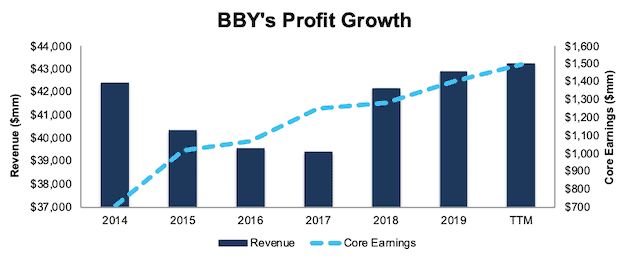
Since 2014, a year after reorganizing its business around the “Renew Blue” strategy, BBY has grown core earnings by 15% compounded annually, per Figure 5. The company has grown revenue 4% compounded annually since bottoming in 2017. BBY has increased its core earnings margin year-over-year (YoY) in five of the past six years and its TTM core earnings margin of 3% is up from less than 1% in fiscal 2012. Since 2014, BBY has increased its ROIC each year from 7% to a top quintile 17% TTM and has generated $8.3 billion (48% of market cap) in cumulative free cash flow over the past five years.
Figure 5: BBY’s Revenue & Core Earnings Since Fiscal 2014
Sources: New Constructs, LLC and company filings
BBY earns our “In-Line” Earnings Distortion Score (as featured on CNBC Squawk Box). While this score means BBY is likely to report in-line with expectations in the short-term, its rising economic earnings, high ROIC, and cheap valuation earn it our Very Attractive stock rating, which focuses on the long-term.
Economic Earnings Show the Complete Picture
Some notable adjustments to BBY’s balance sheet to calculate an accurate ROIC and economic earnings include:
- $2.5 billion in operating leases
- $2.4 billion in accumulated asset write-downs after-tax
- $290 million in accumulated other comprehensive income (page 3 3Q19 10-Q)
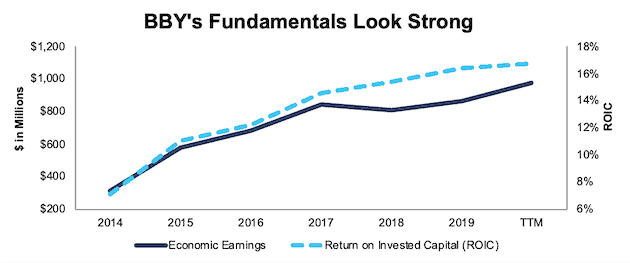
After all adjustments, we find BBY’s TTM economic earnings are up 23% over the prior TTM period. Longer-term, economic earnings have grown 22% compounded annually over the past five years, per Figure 6.
Figure 6: BBY’s Economic Earnings & ROIC Since Fiscal 2014
Sources: New Constructs, LLC and company filings
Maintaining ROIC Advantage
Our research indicates BBY has improved its ROIC at a faster pace than its retail peers under coverage, per Figure 7. Peers include Amazon (AMZN), Costco Wholesale (COST), eBay (EBAY), Kohl’s Corporation (KSS), The Home Depot (HD), Target Corporation (TGT), Walmart Inc. (WMT) and more. Of the peer group, only The Home Depot and eBay earn a higher ROIC than Best Buy.
Figure 7: BBY’s ROIC and Profitability Advantage Over Peers

Sources: New Constructs, LLC and company filings
BBY Has Upside Potential
At its current price of $70/share, BBY has a price-to-economic book value (PEBV) ratio of 0.9. This means the market expects BBY’s NOPAT to permanently decline by 10%. This expectation seems overly pessimistic given that BBY has grown NOPAT by 11% compounded annually since 2014 and 12% compounded annually over the past two decades.
If BBY traded at the level implied by the trend line in Figure 1, it would be worth $144/share today, 105% above its current price. BBY’s current price implies its ROIC will permanently decline to ~10%, a level not seen since fiscal 2014, the first year after its business reorganization.
If BBY can maintain TTM margins of 4% and grow NOPAT by just 3% compounded annually for the next decade, the stock is worth $95/share today – a 36% upside. See the math behind this reverse DCF scenario.
This scenario may prove conservative, as it assumes BBY grows revenue by 3% compounded annually and simply maintains margins. However, Best Buy management aims to grow revenue by 3% compounded annually through 2025 while also improving its operating income margin by 40 basis points. Furthermore, the global consumer electronics market is expected to grow 7% compounded annually through 2024.
In the meantime, BBY investors benefit from a 2.9% dividend yield and seven consecutive years of dividend growth.
The Importance of Fundamentals & Quantifying Expectations
In volatile markets, it pays to incorporate accurate fundamentals into investment decision making. Fundamentals need not be 100% of your process, but they should not be 0%. And, if you’re relying on fundamentals at any level, it pays to make sure you have accurate fundamentals. Investors should not make decisions based on incomplete or less accurate data than what is available. Our Company Valuation Models incorporate all the data from financial filings to truly assess whether a firm is under or overvalued and get an accurate representation of the risk/reward of a stock. For AZO and BBY, the risk/reward looks good.
This article originally published on March 11, 2020.
Disclosure: David Trainer, Kyle Guske II, and Matt Shuler receive no compensation to write about any specific stock, sector, style, or theme.
Follow us on Twitter, Facebook, LinkedIn, and StockTwits for real-time alerts on all our research.
[1] Harvard Business School features the powerful impact of our research automation technology in the case New Constructs: Disrupting Fundamental Analysis with Robo-Analysts.
[2] Our core earnings are a superior measure of profits, as demonstrated in In Core Earnings: New Data & Evidence a paper by professors at Harvard Business School (HBS) & MIT Sloan. The paper empirically shows that our data is superior to IBES “Street Earnings”, owned by Blackstone (BX) and Thomson Reuters (TRI), and “Income Before Special Items” from Compustat, owned by S&P Global (SPGI).
