The underperformance of major value index funds – such as the Russell 1000 Value ETF (IWD) – stems from their reliance on price-to-book (P/B) and other traditional valuation metrics that rely on accounting earnings.
Our analysis[1] of the holdings of over 7,500 U.S. ETFs and mutual funds turned up a value ETF that does a much better job of identifying value stocks than its benchmark. This ETF deserves more attention from investors because it uses free cash flow (FCF), enterprise value, and FCF yield to find quality companies that are significantly undervalued. Pacer Funds U.S. Cash Cows 100 ETF (COWZ) is this week’s Long Idea.
High-Quality Holdings Set COWZ Apart
COWZ ranks in the top 1% of the 7,500 U.S. ETFs and mutual funds we cover, but its $230 million in assets are less than 1% of the $38 billion allocated to the iShares Russell 1000 Value ETF (IWD), which is the largest All Cap Value ETF.
Even though COWZ and IWD are both in the All Cap Value style, Figure 1 shows that these two ETFs are very different. COWZ allocates 52% of its portfolio to Attractive-or-better rated stocks compared to just 26% for IWD. On the other hand, COWZ’s exposure to Unattractive-or-worse rated stocks is just 10%, compared to IWD at 36%. COWZ’s superior asset allocation positions it to capture more upside with lower risk than IWD.
Figure 1: COWZ Asset Allocation Compared to IWD

Sources: New Constructs, LLC and company filings
Using the Right Metrics Matters – Finding Quality Stocks Using Free Cash Flow
COWZ uses free cash flow, free cash flow yield, and enterprise value to find high-quality value stocks. In COWZ’s 2017 report, “Break from the herd. Consider free cash flow”, fund manager Michael Mack wrote,
“Free cash flow is the foundation of a company’s value. It serves as a source of funds, a measure of profitability and most importantly value.”
COWZ also notes that selecting companies based on FCF yield offered the highest annualized return out of other, more popular, valuation metrics studied from 1988-2016. Furthermore, strategies based on FCF yield had the fewest number of 12 month periods with negative returns over the studied time frame as well.
While not perfect (as we’ll show below), COWZ is one step-ahead of other ETFs and mutual funds that use flawed metrics such as price to book or return on equity. In fact, COWZ is one of the few value ETFs that doesn’t used the flawed price-to-book metric in its methodology.
Most importantly, COWZ’s managers don’t just talk the talk about using FCF yield, they walk the walk. The average FCF yield of COWZ’s holdings is 4%, which is double the average for IWD and the S&P 500 (SPY).
COWZ’s Methodology Also Finds Undervalued Stocks
Finding high quality companies is great, but not all good companies are good stocks. To justify their fees, COWZ’s managers must also excel at finding undervalued companies – and they do.
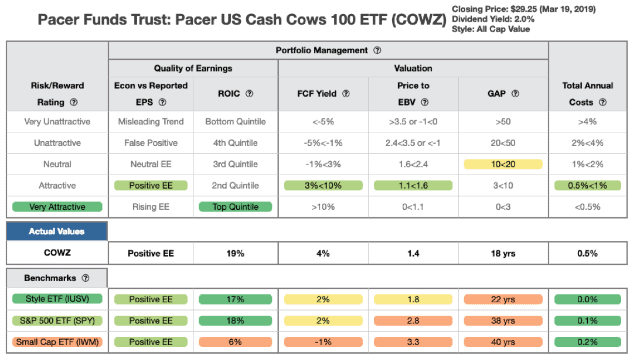
Figure 2 contains our detailed rating for COWZ, which includes each of the criteria we use to rate all ETFs and mutual funds under coverage. These criteria are the same for our Stock Rating Methodology, because the performance of an ETF or mutual fund equals the performance of its holdings minus fees.
Figure 2: Pacer U.S. Cash Cows 100 ETF Fund Rating Breakdown

Sources: New Constructs, LLC and company filings
As Figure 2 shows, COWZ’s holdings are superior to the style benchmark, iShares Core S&P U.S. Value ETF (IUSV), and the overall market (SPY) in four out of the five criteria that make up our holdings analysis:
- COWZ’s return on invested capital (ROIC) is 19%, which is greater than the 17% and 18% earned by IUSV and SPY respectively.
- COWZ’s free cash flow yield of 4% is double IUSV and SPY at 2%.
- The price to economic book value (PEBV) ratio for COWZ is 1.4, which is less than the 1.8 for IUSV holdings and nearly half the 2.6 of SPY.
- Our discounted cash flow analysis reveals an average market implied growth appreciation period (GAP) of 18 years for COWZ holdings compared to 22 years for IUSV and 38 years for SPY.
COWZ holds stocks that are both more profitable and less expensive than IUSV and SPY.
Above Average Costs Are Offset by Quality Holdings
COWZ’s 0.54% total annual costs are above the weighted average of all All Cap Value ETFs under coverage, which sits at 0.29%. However, COWZ justifies its costs by executing an intelligent investment strategy and being only one of three (out of 26) All Cap Value ETFs to earn an Attractive Portfolio Management Rating.
Top Holdings Found Looking Beyond Traditional Metrics
We can see how COWZ’s methodology helps managers avoid value traps and find high-quality stocks by looking at one of its top holdings.
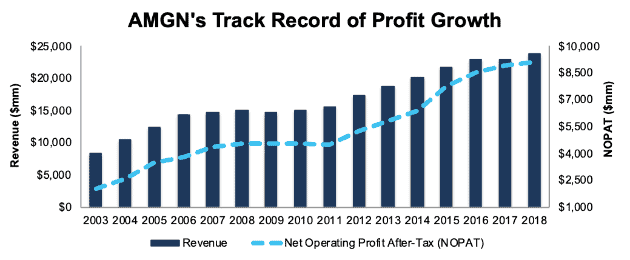
We made Amgen Inc. (AMGN: $191/share) a Long Idea in May 2017 and reiterated that call in December 2018. The stock continues to earn our Very Attractive rating. Over the past decade, AMGN has grown its after-tax operating profit (NOPAT) by 7% compounded annually. It has improved its ROIC from 16% in 2008 to a top-quintile 25% in 2018. In addition, AMGN has generated a positive FCF yield in nine of the past ten years.
Figure 3: AMGN’s Revenue & Profit Growth Since 2003

Sources: New Constructs, LLC and company filings
Not only does AMGN exhibit the strong fundamentals of a high-quality company, its stock is also cheap. At its current price of $191/share, AMGN has a price-to-economic book value (PEBV) ratio of 0.9. This ratio means the market expects AMGN’s NOPAT to permanently decline by 10%. This expectation seems pessimistic for a firm that has consistently grown NOPAT to the tune of 13% compounded annually since 1998.
If AMGN can maintain 2018 NOPAT margins (38%) and grow NOPAT by just 2% compounded annually for the next decade, the stock is worth $224/share today – a 17% upside. See the math behind this dynamic DCF scenario.
Beyond AMGN, COWZ finds value stocks that many other value ETFs overlook. Due to their reliance on P/B ratio, value indexes systematically underweight the Technology sector. By using FCF yield, COWZ successfully finds value in this sector and allocates 34% of assets to Technology companies. Some of its highest-rated Technology holdings include previous Long Ideas Lam Research Corp (LRCX) and F5 Networks (FFIV).
COWZ’s Methodology Could Still Be Improved
Despite its ability to find quality, undervalued stocks, COWZ’s methodology is not without flaws. While it eschews P/B ratios, COWZ still uses price-to-earnings (P/E) to analyze a stocks’ valuation.
We detailed many of the flaws with P/E ratios in our article “P/E Ratios Are Misleading… Especially Right Now.” We’ve also covered many of the problems with flawed accounting data that can give a misleading picture of a firm’s valuation relative to its true cash flows. Using P/E can lead COWZ’s managers to pick stocks that look cheap using P/E, but are actually overvalued when one analyzes the expectations baked into their stock prices, such as WestRock Company (WRK), Olin Corporation (OLN), and NXP Semiconductors (NXPI).
LogMeIn Inc. (LOGM: $82/share) on the other hand, looks expensive using P/E and our reverse DCF model. What’s worse, LOGM only appears to earn positive free cash flow if one ignores the cost of acquisitions. When we take into account the capital spent on acquisitions in the past two years, we see that LOGM is both unprofitable and overvalued.
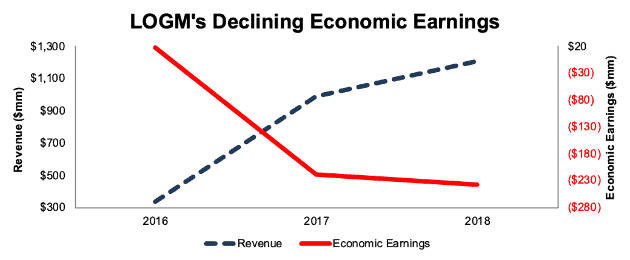
The decline in LOGM’s fundamentals began with its overpriced acquisition of Citrix’s GoToMeeting in 2017. Prior to the acquisition, LOGM earned an 18% ROIC, had an 8% NOPAT margin, and generated positive economic earnings. LOGM’s ROIC has fallen to 2% in 2018, its NOPAT margin sits at 5%, and its economic earnings, the true cash flows of the business, fell from $17 million in 2016 to -$238 million in 2018.
Figure 4: LOGM’s Economic Earnings Reveal Growing Losses

Sources: New Constructs, LLC and company filings
LOGM’s value-destroying acquisitions continued in 2018 with the $345 million deal for Jive Communications. After accounting for the cash paid in this acquisition, LOGM’s free cash flow was -$42 million in 2018.
Given the deteriorating fundamentals above, and our analysis of the expectations baked into its stock price, LOGM appears to be a low-quality company and overvalued stock – not a winning combination.
To justify its current price of $82/share, LOGM must maintain current NOPAT margins (5%) and grow NOPAT by 15% compounded annually for the next 19 years. See the math behind this dynamic DCF scenario. Such a scenario implies LOGM can grow revenue by more than three times consensus expectations (4% in 2019, 5% in 2020).
Even if LOGM can maintain current margins and grow NOPAT by 10% compounded annually for the next decade, the stock is worth just $22/share today – a 73% downside. See the math behind this dynamic DCF scenario.
Luckily for investors, LOGM appears to be the outlier (as it represents <1% of assets) in what is largely a strong portfolio.
The Importance of Holdings Based Analysis
Smart ETF (or mutual fund) investing means analyzing the holdings of each ETF. Failure to do so is a failure to perform proper due diligence. Simply buying an ETF or fund based on past performance does not necessarily lead to outperformance. Only through holdings based analysis can one determine if a fund’s managers are sticking to their stated methodology and truly allocating to high-quality stocks, as COWZ does.
However, most investors don’t realize they can already get the sophisticated fundamental research that Wall Street insiders use. Our Robo-Analyst technology analyzes the holdings of all 401 ETFs and mutual funds in the All Cap Value style and 7,500+ ETFs and mutual funds under coverage. The number of holdings in these All Cap Value ETFs and mutual funds varies from just 18 stocks to 1,546 stocks in a given fund. Our diligence on holdings allows us to cut through the noise and find ETFs, like COWZ, with a portfolio and methodology that suggests future performance will be strong.
This article originally published on March 20, 2019.
Disclosure: David Trainer, Kyle Guske II, and Sam McBride receive no compensation to write about any specific stock, style, or theme.
Follow us on Twitter, Facebook, LinkedIn, and StockTwits for real-time alerts on all our research.
[1] Harvard Business School features our Robo-Analyst research automation technology in the case New Constructs: Disrupting Fundamental Analysis with Robo-Analysts.
