
We closed this position on August 10, 2020. A copy of the associated Position Update report is here.
The real cash flows of corporate America are in decline, but certain sectors are still growing profits. We featured the semiconductor equipment sector last year in our article, “Selling Shovels in a Gold Rush: Buy This Sector to Profit From the Internet of Things.” Since then, the fundamentals have only become more attractive.
We’ve already written individual reports on two of the featured stocks from that article, KLA Tencor (KLAC) and Kulicke & Soffa (KLIC), both of which have outperformed the market since our reports were published. However, a third featured stock from that report is cheaper than KLAC, more profitable than KLIC, and has outperformed both over the past year. Lam Research (LRCX: $203/share) is this week’s Long Idea.
Accounting Earnings Understate Profit Growth
It’s no secret that LRCX is growing rapidly. The company’s revenue has grown by double digits every year going back to 2013. It grew 43% over the past twelve months. Investors that just look at accounting earnings, though, might not fully appreciate the extent to which LRCX is converting this revenue into profit.
Figure 1 shows that growth in economic earnings – the true cash flows of the business – has outpaced the growth in GAAP net income for each of the past three years as well as the trailing twelve month (TTM) period.
Figure 1: Economic Earnings and GAAP Net Income Growth Since 2013
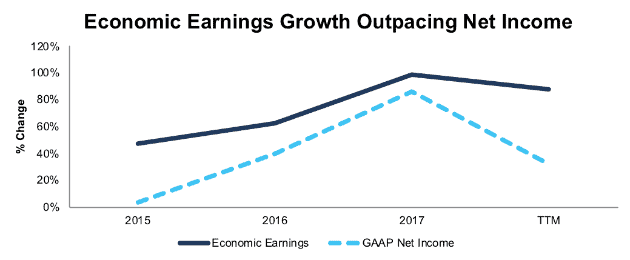
Sources: New Constructs, LLC and company filings
TTM GAAP earnings growth is artificially depressed by a $704 million (7% of revenue) one-time tax expense due to the impact of tax reform. Amazingly, LRCX still grew reported earnings by 32% even when including the non-operating tax expense, but when we strip out the charge, we see that economic earnings grew by 88%.
Since 2014, GAAP earnings have nearly tripled, but economic earnings have grown more than 7x. As good as LRCX’s reported numbers look, the actual economics of the business are even better.
Superior Efficiency Metrics Show Competitive Advantage
Skeptics might attribute LRCX’s growth solely to favorable industry conditions, but comparison to its peers proves otherwise. Five years ago, the company had below average margins and invested capital turns (a measure of balance sheet efficiency) when compared to other companies in the Semiconductor Equipment and Testing industry. Now, it ranks near the top in both metrics.
Figure 2 shows LRCX’s after-tax operating profit (NOPAT) margin compared to its peers since 2013.
Figure 2: LRCX’s Rising Margin Advantage
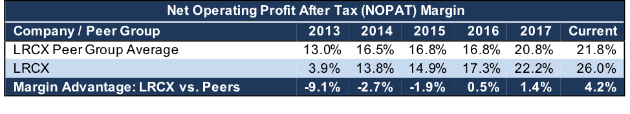
Sources: New Constructs, LLC and company filings
LRCX’s current NOPAT margin of 26% trails only KLAC at 30% among its peers. LRCX has also gone from below average to near the top in capital turns, as shown in Figure 3.
Figure 3: LRCX’s Rising Capital Turns Advantage
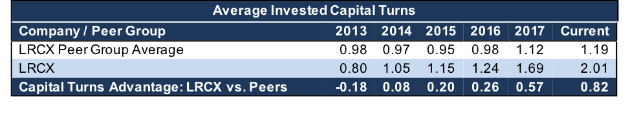
Sources: New Constructs, LLC and company filings
Only Ultra Clean Holdings (UCTT) has superior capital turns at 2.57. LRCX is among the best companies in its peer group at turning capital on the balance sheet into revenue, and then turning that revenue into profit.
Since NOPAT margin and invested capital turns are the two components of return on invested capital (ROIC), it should come as no surprise that LRCX’s ROIC has improved much more rapidly than peers in recent years. Figure 4 has the details.
Figure 4: LRCX’s Rising ROIC Advantage
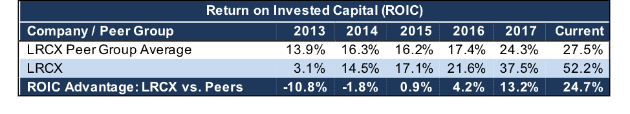
Sources: New Constructs, LLC and company filings
The semiconductor equipment industry has enjoyed favorable conditions over the past few years that have led its average ROIC to nearly double, but LRCX’s improvement has been much more rapid than its peers’.
More Complex Chips Benefit LRCX
For decades, improvements in processing power have followed Moore’s Law, which states that the number of transistors per square inch that can fit on an integrated circuit double every two years. This trend can’t last forever, and many experts believe that the current generation of chips, which have gotten as small as 5 nanometers, may be pushing up against the limits of Moore’s Law.
Even as the potential gains from denser circuitry decline, the demand for processing power is only increasing. Artificial Intelligence (AI) uses a huge amount of processing power, enough to put a strain on the computing resources of even a giant company like Alphabet (GOOGL). Chipmakers need to find new ways to keep improving processing power to meet this rising demand.
To overcome this hurdle, chipmakers are turning to three-dimensional circuit architectures featuring stacked silicon wafers with vertical connections. The manufacturing process for 3D chips involves significantly more complexity, which in turn drives demand for LRCX’s solutions in areas such as thin film deposition, etching, and wafer cleaning.
LRCX has capitalized on this shift in demand and improved its market share in recent years. The company grew revenue by 36%, 12%, and 14% in 2017, 2016, and 2015 while the semiconductor equipment industry grew revenue by 26%, 10%, and 4%. The company improved its market share from 19% in 2016 to 21% in 2017 and continues to grow its share in 2018.
Fears of a Cyclical Crash are Overblown
In the face of this rapid growth, the bear case against LRCX rests on the idea that the industry is near the peak of a “semiconductor supercycle.” The semiconductor industry has been highly cyclical in the past, and some analysts fear that, since profits are higher than ever, the crash in demand and prices will be equally large.
We addressed this bear case in our original industry analysis. Increased demand from AI and the Internet of Things has pushed profits to these new highs, and there’s no reason to expect that demand to subside anytime soon. Major tech companies such as Alphabet, Apple (AAPL), and Amazon (AMZN) keep designing new AI chips, and chipmakers are struggling to keep pace with production demands.
Some people worry that rising chip prices will lead to overinvestment in new production capability, which will ultimately lead to oversupply and crashing prices. We think the risk here is overstated for two key reasons:
- Industry Consolidation: The semiconductor industry has gone through a major wave of consolidation over the past decade and a half. The number of major players in the industry declined from nearly 30 in 2000 to just 13 in 2008, and that number could fall even further. Similar to the airline industry, this consolidation should reduce the risk of extreme competition leading to oversupply.
- China Demand: The Chinese government sees building its semiconductor manufacturing industry as a strategic priority. Even if chip prices do fall, government subsidies might keep production levels stable in this key and growing market.
In addition, the increasing complexity of chip designs should shift more of the value toward sophisticated equipment providers such as LRCX. Even if chip production does experience a cyclical decline, this shift should cushion the impact for LRCX and lead to less profit decline than in previous cycles.
Superior ROIC Is Correlated with Shareholder Value
Numerous case studies show that getting ROIC right is an important part of making smart investments. Ernst & Young recently published a white paper that proves the material superiority of our forensic accounting research and measure of ROIC. The technology that enables this research was featured in Harvard Business School.
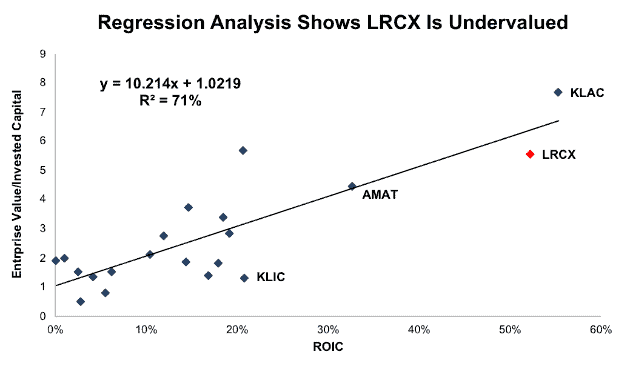
Per Figure 5, ROIC explains 70% of the difference in valuation for the 20 stocks we cover in the Semiconductor Equipment and Testing sector. Despite its rapid growth and favorable industry position, LRCX trades at a significant discount to its peers based on its position below the trend line in Figure 5. Former Long Idea KLIC is one of the only companies that is cheaper, while Long Idea KLAC is the only company that has a higher ROIC. LRCX is both cheaper and more profitable than the largest company in the industry, Applied Materials (AMAT).
Figure 5: ROIC Explains 70% of Valuation for LRCX Peers
Sources: New Constructs, LLC and company filings
LRCX’s enterprise value per invested capital (which is a cleaner version of price to book that does a better job of capturing the capital invested in the business) implies that the market expects the company’s ROIC to decline from 52% to 44%.
If the stock were to trade at parity with its peers, it would be worth $227 per share, 12% above the current share price. With LRCX’s track record of growth and profitability, we would argue it deserves to be valued at a premium.
LRCX Offers Significant Upside
LRCX’s profit growth has already delivered significant returns for investors. Since we featured the stock as one of our top picks in the sector last June, it’s up 32%, compared to 21% for the NASDAQ (QQQ). Over the past five years, the stock is up over 300%.
Despite this increase in the stock price, the growth expectations implied by the valuation remain low. At its current price of ~$203/share, LRCX has a price to economic book value (PEBV) ratio of 1. This ratio implies that the market expects the company to never meaningfully grow NOPAT from the current level. At this valuation, any long-term growth should translate into upside for LRCX investors.
If LRCX can maintain its TTM NOPAT margin of 26% and grow revenue from its 2017 level by 7% compounded annually for the next decade, the stock is worth $280/share today, a 38% upside from the current stock price. See the math behind this dynamic DCF scenario here. Even this forecast may be overly pessimistic, as it only gives LRCX credit for 30% revenue growth in 2018 when the company is on track to grow revenue by 38%.
Continued Growth Could Send Shares Higher
LRCX doesn’t just look cheap by our metrics. The stock has a below-average P/E of 19, which indicates that the market believes its strong growth rates will decline soon. If LRCX can continue to grow revenue and profits, its stock should continue to outperform.
Citi (C) projects the global wafer fabrication equipment (WFE) market to hit $61 billion in 2019, and LRCX projects that its serviceable addressable market will soon reach 40% of WFE spending. That leaves LRCX with a total market opportunity of $24 billion, more than double its current revenue.
We don’t expect LRCX to capture the entirety of that $24 billion addressable market, but the size of the opportunity shows that there’s still plenty of room for growth, especially compared to the expectations baked into the current stock price.
A Growing Dividend and Share Repurchases Provide Nearly 8% Yield
LRCX has increased its quarterly dividend in each of the last four years. Earlier this year, the company more than doubled its quarterly dividend, from $0.50/share to $1.10/share. The current dividend provides a 2.2% annual dividend yield. Best of all, LRCX generates the necessary cash flow to continue paying its dividend. It earned $2.1 billion in free cash flow over the past twelve months, while its dividend yield equates to ~$700 million in annual payments.
In addition to dividends, LRCX has returned capital to shareholders via share repurchases. LRCX repurchased $1.9 billion worth of shares over the past year and has more than $3 billion remaining on its share repurchase authorization. If the company buys back shares at the same rate going forward, it will buyback ~5.8% of the current market cap. When combined with the 2.2% dividend yield, the total yield to shareholders could reach 8%.
Executive Compensation Plan Could be Improved but Hasn’t Led to Value Destruction
Annual bonuses for LRCX executives are tied to market share and “strategic, operational, and organizational development goals.” 50% of long-term incentives are awarded via performance-based shares, which are tied to relative stock price performance.
While it’s good that LRCX does not encourage executives to chase easily manipulated metrics such as Adjusted EBITDA, we would like to see them more directly align executives with long-term shareholders. Chasing market share can be destructive if it leads to excessive discounting or poor capital allocation. Tying compensation to stock price performance can lead to risky behavior and high-profile blowups, i.e. Valeant (VRX).
It would be better for shareholders if LRCX tied a significant portion of executive compensation to ROIC. There is a strong correlation between improving ROIC and increasing shareholder value[1], so tying exec comp to ROIC ensures that executives’ interests are properly aligned with shareholders’ interests.
However, despite excluding ROIC and using metrics not directly tied to increasing shareholder value, LRCX’s current plan has not led to executives getting paid while destroying shareholder value. As noted above, LRCX has outperformed its peers in terms of ROIC and grown economic earnings rapidly in recent years.
Insider Trading is Minimal While Short Interest is Moderate
Insider activity has been minimal over the past 12 months with 84 thousand shares acquired and 397 thousand shares sold for a net effect of 313 thousand shares sold. These sales represent less than 1% of shares outstanding.
There are currently 12 million shares sold short, which equates to 7% of shares outstanding and 2.5 days to cover. Short interest has stayed fairly constantly in a range from 9 million to 13 million shares over the past year.
Critical Details Found in Financial Filings By Our Robo-Analyst Technology
As investors focus more on fundamental research, research automation technology is needed to analyze all the critical financial details in financial filings. Below are specifics on the adjustments we make based on Robo-Analyst[2] findings in Lam Research’s 2017 10-K:
Income Statement: we made $116 million of adjustments, with a net effect of removing $78 million in non-operating expense (1% of revenue). We removed $19 million in non-operating income and $97 million in non-operating expenses. You can see all the adjustments made to LRCX’s income statement here.
Balance Sheet: we made $6.5 billion of adjustments to calculate invested capital with a net decrease of $5.3 billion. The most notable adjustment was $5.9 billion in excess cash. This adjustment represented 64% of reported net assets. You can see all the adjustments made to LRCX’s balance sheet here.
Valuation: we made $8.8 billion of adjustments with a net effect of increasing shareholder value by $3 billion. Apart from the excess cash noted above, the largest adjustment was $2.8 billion in total debt, which includes $100 million in off-balance sheet debt. This adjustment represents 8% of the market cap.
Attractive Funds That Hold LRCX
The following funds receive our Attractive-or-better rating and allocate significantly to Lam Research.
- VanEck Vectors Semiconductor ETF (SMH) – 5.0% allocation and Attractive rating.
- First Trust NASDAQ Semiconductor ETF (FTXL) – 4.2% allocation and Very Attractive rating.
- Direxion Daily Semiconductor Bull 3X Shares (SOXL) – 3.4% allocation and Attractive rating.
- Nationwide Bailard Technology & Science Fund (NWHUX) – 3.3% allocation and Attractive rating.
- Guinness Atkinson Global Innovators Fund (GINNX) – 3.2% allocation and Very Attractive rating.
This article originally published on May 23, 2018.
Disclosure: David Trainer, Kyle Guske II, and Sam McBride receive no compensation to write about any specific stock, style, or theme.
Follow us on Twitter, Facebook, LinkedIn, and StockTwits for real-time alerts on all our research.
[1] Ernst & Young’s recent white paper “Getting ROIC Right” demonstrates the link between an accurate calculation of ROIC and shareholder value.
[2] Harvard Business School features the powerful impact of our research automation technology in the case study New Constructs: Disrupting Fundamental Analysis with Robo-Analysts.