We closed the H position on January 11, 2022. A copy of the associated Position Update report is here.
Last week, we looked at three of our worst Long Ideas from 2020. This week, we’re taking some victory laps for picks that outperformed from the date we published our reports through the end of 2020.
Best Buy Co, Inc. (BBY: $114/share), General Motors Co (GM: $48/share), and Hyatt Hotels (H: $74/share) are the Long Idea highlights for 2020. Despite their outperformance, we remain bullish on these stocks, and they remain open Long Ideas.
Long Ideas Outperformed in 2020
Figure 1 shows that the average return of Long Ideas outperformed the S&P 500 from the date of publication through December 31, 2020 by 5.7%.
Our Long Ideas combine our proprietary fundamental data, proven superior to traditional data providers by a paper forthcoming in The Journal of Financial Economics[1], with qualitative research to highlight firms whose stocks present excellent risk/reward. Long Ideas show investors how to use our research and the transparency of our analytical processes.
Figure 1: Long Idea Performance: From Date of Publication Through 12/31/2020

Sources: New Constructs, LLC
Highlight 1: Best Buy Co, Inc. (BBY) – Since Report Publication on March 11 Through 12/31/20: Up 53% vs. S&P 500 up 37%
We first made Best Buy a Long Idea in April 2018 and reiterated it in November 2018 and March 2020. Our report in March 2020 suggested that companies with high returns on invested capital (ROIC), such as Best Buy, are best-prepared to weather financial storms. Sure enough, Best Buy’s business has become more profitable during the COVID-19-related disruptions to the economy.
What Went Right: As many business struggled during the pandemic, Best Buy thrived as growth in work from home (WFH) led to increased demand for the firm’s equipment and services. Best Buy successfully leveraged its e-commerce capabilities and distribution network to quickly serve its current customers and attract new ones. Increased revenue coupled with improved net-operating profit after tax (NOPAT) margin and invested capital drive the firm’s ROIC from 17% in fiscal 2020 to 21% over the trailing-twelve-months (TTM).
Why BBY Still Has Upside: Best Buy can continue to grow its online business with exceptional delivery speed at little incremental cost by leveraging its physical stores as a distribution network to support order fulfillment. With over 70% of the U.S. population living within 10 minutes from a Best Buy, the firm has a brick-and-mortar presence that even Amazon would envy.
Since February 2020, Best Buy increasingly utilized its stores in fulfilling online orders. The firm now offers same-day delivery in all of its stores and next-day delivery for orders placed before 8 pm. Customers also have the flexibility to shop in store or online and pick up purchases curbside.
Furthermore, Best Buy aims to offer something most online businesses are unable to provide – quality customer service online. The firm is now providing live, online customer support to customers with its in-store staff. As the world moves towards a post-COVID economy, Best Buy is well positioned to meet consumer needs via any distribution channel.
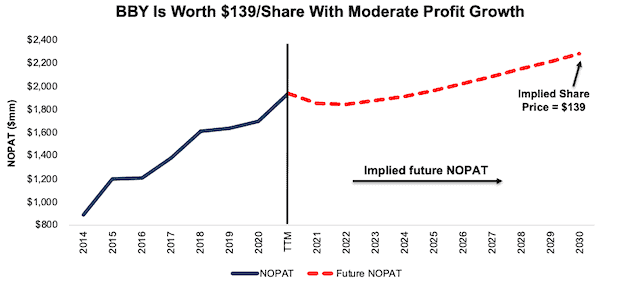
Current Price Leaves Lots of Upside: We use our reverse discounted cash flow (DCF) model to analyze the implied value of the stock based on assumptions about Best Buy’s future growth in cash flows.
In this scenario, we assume:
- Best Buy’s NOPAT margin falls to 3.9% (equal to fiscal 2020 compared to 4.2% TTM)
- Revenue grows at 3% compounded annually, which is below the average annual global GDP growth rate of 3.5% since 1961
In this scenario, Best Buy’s NOPAT grows by just 3% compounded annually over the next decade and the stock is worth $139/share today – a 22% upside to the current price. See the math behind this reverse DCF scenario. Such a scenario could prove conservative given that Best Buy has grown NOPAT by 11% compounded annually since 2014.
Figure 2: Best Buy’s Historical and Implied NOPAT

Sources: New Constructs, LLC and company filings
Highlight 2: General Motors Co (GM) – Since Report Publication on July 15 Through 12/31/20: Up 55% vs. S&P 500 up 16%
General Motors was one of the firms featured in our “See Through the Dip” series of reports, where we make the case for a return to pre-pandemic profitability once COVID-19 is in the rear view mirror. Though the stock has rallied from lows of $17/share in late March 2020, it still offers plenty of upside in the ongoing recovery.
What Went Right: While the pandemic greatly affected General Motors’ production and disrupted its supply chain, the firm has been able to deliver promising results in the challenging environment. In fact, in 3Q20, the firm delivered its first quarterly year-over-year (YoY) sales increase since 4Q18. The firm continues to see success as it increases its focus on EV production, too. General Motors launched a new EV in China which became the country’s best-selling EV in 3Q20.
Why GM Is Still Has Upside: As many investors look to Tesla (TSLA) to lead the way in EV, General Motors is actually better positioned to thrive in the growing EV market.
General Motors’ existing business gives it a large research and development advantage over EV startups. With existing manufacturing expertise and capacity, the firm can focus on developing EV technology, convert existing plants, and produce higher-quality EVs at scale. With the free cash flow (FCF) generated from the firm’s conventional vehicle business, General Motors plans to invest $27 billion in EV and autonomous vehicles through 2025. At only $10.9 billion over the past five years and $2.4 billion over the TTM, Tesla’s capex has been much lower than what GM plans. Tesla has not revealed what its capex going forward will be.
General Motors’ investments in EV are already paying off in the most important part of General Motors’ EV strategy: battery technology designed to easily scale across various models. General Motors’ Ultium-based EV’s will offer a range of 450 miles per charge, or approximately the same the mileage achieved from a tank of gasoline.
Once General Motors has the technology it needs, it can easily mass produce EVs with its existing and proven manufacturing capacity. By 2025, the firm plans to launch 30 new EV models. Newer firms such as Tesla must heavily invest new capital in developing their own manufacturing capabilities with the hope they can achieve comparable scale to GM.
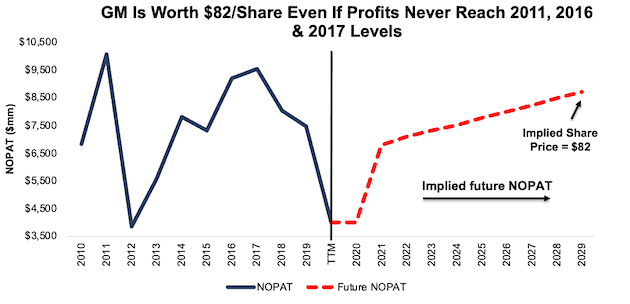
Current Price Leaves Lots of Upside: Below we use our reverse DCF model to analyze the implied value of the stock based on different assumptions about General Motors’ future growth in cash flows.
In this scenario, we assume:
- General Motors’ NOPAT margin improves to 5% (ten-year average vs. 3% TTM)
- Revenue falls by 13% in 2020 and grows by 12% in 2021 and 4% in 2022 (in line with consensus estimates)
- Revenue grows at 3% compounded annually thereafter, which is below the average global GDP growth rate of 3.5% since 1961
In this scenario, General Motors’ NOPAT grows by just 2% compounded annually over the next decade and the stock is worth $82/share today – a 71% upside to the current price. See the math behind this reverse DCF scenario. In this scenario, General Motors’ NOPAT in 2029 would still be 9% below 2017 levels.
Figure 3 General Motors’ Historical and Implied NOPAT

Sources: New Constructs, LLC and company filings
Highlight 3: Hyatt Hotels (H) – Since Report Publication on May 14 Through 12/31/20: Up 59% vs. S&P 500 up 32%
Like General Motors, Hyatt was also part of our “See Through the Dip” thesis. Even though challenges to the hospitality industry persist, we believe Hyatt will improve its market share during and after the economic downturn.
What Went Right: While the pandemic has been extremely challenging for the hospitality industry, Hyatt has navigated the challenges well. At the end of 3Q20, 59% of the firm’s hotels were back to operating at a break-even-or-better occupancy level.
Why H Is Still Has Upside: Even though the firm’s 3Q20 revenue is down 67% YoY, its 58% quarter-over-quarter improvement is a sign that the firm’s business is on the path to recovery. We believe the YoY decline in revenue is temporary in line with our “See Through the Dip” thesis.
This industry-wide decline in demand creates opportunity for market leaders, such as Hyatt, over the long term. Hyatt is poised to take the market share left behind by hotels that don’t survive the present downturn. With this goal in mind, the firm continues to develop its accommodations and build for the future as it increased its net rooms in 3Q20 by 6% YoY (up from 5.8% YoY growth in 3Q19).
Further recovery in travel will continue to drive the recovery in the hospitality industry. CBRE Hotels Research expects U.S. occupancy levels for hotels to reach 44% in 1H21 and 56% in 2H21. For reference, Hyatt estimates it’s break-even occupancy rate is around 37%.
Much of the recovery the firm has already seen comes from its Asian portfolio as nearly all of its properties in China, Hong Kong, Macau, and Taiwan are at pre-pandemic occupancy rates. Though parts of its business are already at pre-pandemic levels, the valuation of the firm’s stock isn’t, as we’ll show below.
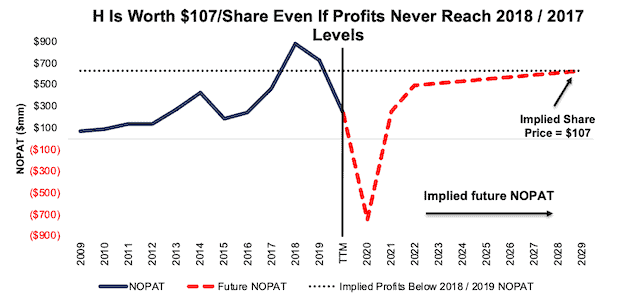
Current Price Leaves Lots of Upside: Below we use our reverse DCF model to analyze the implied value of the stock based on different assumptions about Hyatt’s future growth in cash flows.
In this scenario, we assume:
- Hyatt’s NOPAT margin falls to -35% in 2020 (below 3Q20 margin of -32%) and improves to 8% (equal to TTM margin) in 2021
- Hyatt improves NOPAT margin to 11% (five-year average) in 2022 and each year thereafter
- Revenue falls by 58% in 2020 and grows by 57% in 2021 and 38% in 2022 (in line with consensus estimates)
- Revenue grows at 3.5% thereafter, which is the average annual global GDP growth rate since 1961
In this scenario, Hyatt’s NOPAT falls by 1% compounded annually over the next decade and the stock is worth $107/share today – a 45% upside to the current price. See the math behind this reverse DCF scenario. Such a scenario could prove conservative given that Hyatt has grown NOPAT by 11% compounded annually over the past five years and 26% compounded annually over the decade before the pandemic.
Figure 4: Hyatt’s Historical and Implied NOPAT

Sources: New Constructs, LLC and company filings
This article originally published on January 13, 2021.
Disclosure: David Trainer owns H. David Trainer, Kyle Guske II, and Matt Shuler receive no compensation to write about any specific stock, sector, style, or theme.
Follow us on Twitter, Facebook, LinkedIn, and StockTwits for real-time alerts on all our research.
[1] Our reports utilize our Core Earnings, a superior measure of profits, as demonstrated in Core Earnings: New Data & Evidence, a paper by professors at Harvard Business School (HBS) & MIT Sloan. Recently accepted by the Journal of Financial Economics, the paper proves that our data is superior to all the metrics offered elsewhere.
