This major automobile manufacturer has experienced disruptions to its operations as demand for automobiles has temporarily fallen. However, investors who look past this short-term decline can find great long-term value. General Motors (GM: $26/share) is this week’s Long Idea.
We first made General Motors a Long Idea in March 2018. We reiterated the pick in November 2018, July 2019, and again in January 2020. Since March 2018, General Motors’ stock (-29%) has underperformed the S&P 500 (+13%). The stock remains undervalued and, given the COVID-driven price decline, offers significant upside.
General Motors’ Profits
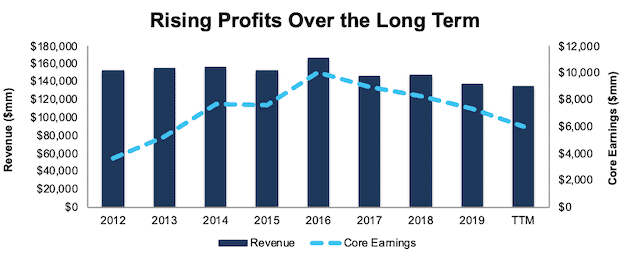
From 2010 to 2019, General Motors grew core earnings[1] by 2% compounded annually, per Figure 1. More recently, the firm has increased core earnings by 10% compounded annually over the past seven years. General Motors increased its core earnings margin from 2% to 5% over the same time.
Profits have declined in recent years, as the firm has divested of less successful operations, such as its Europe operations and streamlined its offerings. However, the firm is seeing signs of increasing demand in its core brands and is positioned for a future electric world, as we’ll show later in this report.
As expected, trailing-twelve-month (TTM) core earnings have declined significantly as the COVID-19 pandemic shuttered economies across the globe. We expect core earnings and other profitability metrics may get worse before they get better. Our thesis does not depend on profit growth, as we’ll explain in the valuation section of this report.
Figure 1: Core Earnings & Revenue Growth Since 2012
Sources: New Constructs, LLC and company filings.
The current downward profit trend is temporary, not permanent, and masks General Motors’ long-term ability to generate significant free cash flow (FCF). The company generated positive FCF in eight of the past 9 years and a cumulative $16.4 billion (46% of market cap) in FCF over the past five years.
Executive Compensation Properly Incentivizes Management
No matter the macro environment, investors should look for companies with executive compensation plans that directly align executives’ interests with shareholders’ interests. Quality corporate governance holds executives accountable to shareholders by incentivizing them to allocate capital prudently.
83% to 90% of General Motors’ executives’ compensation is performance-based. The firm issues stock options and performance share units (PSUs) as part of its long-term incentive plan. Half of available PSUs are tied to the firm’s three-year ROIC-adjusted performance relative to a peer group and the other half to relative total shareholder return. The firm’s short-term incentive plan rewards executives for meeting EBIT-Adjusted, Adjusted Automotive Free Cash Flow (AFCF), and strategic targets.
In total, ROIC performance comprises 23% to 26% of total executive compensation. General Motors has linked executive compensation to ROIC performance since 2014. By emphasizing ROIC, General Motors’ executive compensation plan is better aligned with creating shareholder value than many other companies as there is a strong correlation between improving ROIC and increasing shareholder value.
This focus on ROIC has helped the firm create real value for its shareholders. General Motors has grown economic earnings from -$35 million in 2012 to $1.3 billion TTM.
Ample Liquidity to Survive the Downturn
While the COVID-19 pandemic has disrupted General Motors’ operations in the short term, the firm’s available liquidity positions it to weather the downturn. At the end of 1Q20, General Motors had $33.4 billion of available liquidity including $15.9 billion it drew down on its credit facilities. Since then, the firm raised an additional $4 billion in May 2020 from a senior notes offering. The firm also extended revolving credit lines by an additional $3.6 billion in April 2020. Altogether, the firm has ~$41 billion in liquidity.
To illustrate the firm’s strong liquidity position, we review a worst-case scenario, where General Motors generates no revenue and incurs the total monthly cash costs of ~$2.0 billion disclosed in its 1Q20 10-Q. In addition to these costs, we also assume the firm maintains its capex spending consistent with its 2Q20 target of $1.5 billion, or $500 million per month. In such a scenario, the firm could operate for over 16 months with its available liquidity before needing additional capital.
It’s also highly unlikely that General Motors’ revenue would go to zero. The firm noted on July 1 that all truck and full-size SUV plants returned to three shifts in the U.S. Furthermore, during 2Q20 (including the peak of COVID-19 disruptions), General Motors delivered 492,489 vehicles – just a 34% decline from a year ago. The firm also noted in its 1Q20 earnings call that it anticipates its breakeven free cash flow level to be at a 25% reduction in demand. For reference, global auto sales are expected to fall 22% YoY in 2020.
General Motors’ Profitability Is Among the Best
General Motors’ profitability was superior to most competitors before the crisis, and the firm is well-positioned to return to profit growth when the economy recovers.
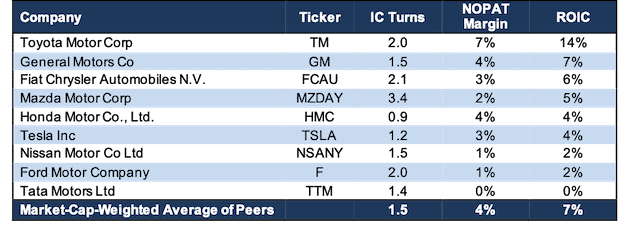
General Motors’ invested capital turns, a measure of balance sheet efficiency, rank fifth among its peer group. However, the firm has the second highest NOPAT margin among its peers. The peer group consists of eight other automobile manufacturers including Tesla Inc (TSLA), Toyota Motor Corp (TM), Honda Motor Co., Ltd. (HMC), Ford Motor Company (F), Fiat Chrysler Automobiles N.V. (FCAU), Nissan Motor Co Ltd (NSANY), Mazda Motor Corp (MZDAY), and Tata Motors Ltd (TTM).
General Motors’ high margins help the firm achieve a high ROIC. Per Figure 2, General Motors’ current ROIC of 7% ranks second among all peers.
Figure 2: Invested Capital (IC) Turns, NOPAT Margin, and ROIC vs. Peers (TTM)
Sources: New Constructs, LLC and company filings.
Unless you believe that there will be no need for automobiles in a post-COVID-19 world, it’s hard to argue against General Motors’ ability to survive. And, if it survives, it’s hard to argue against the firm’s high profitability before the crisis translating into profit growth in a recovery.
While short-term demand has been impacted by COVID-19-related disruptions, we believe a recovery is likely over the long term since the International Monetary Fund (IMF) and nearly every economist in the world believe the global economy will grow strongly in 2021. The IMF estimates the global economy will expand by 5.4%, and the U.S. economy by 4.5%, in 2021. Fitch Ratings projects global GDP growth of 5.1% in 2021, and for “pre-virus levels of GDP” to be reached in mid-2022 in the US and later in Europe. The overall growth in the economy should lead to a rebound in consumer activity, which will drive demand for automobiles.
General Motors’ Core Business Is Strong
Despite the decline in core earnings noted above, General Motors’ full-size trucks, crossovers, and Cadillac brand are strong and are growing market share. The Chevrolet Silverado and GMC Sierra are General Motors’ two full-size pickup models. Combined, sales of the Silverado and Sierra represented 37% share of the full-size truck market in 2019, up from 36% in 2018.
The firm has also successfully grown its crossover business in the U.S. In 2017, General Motors increased its crossover sales from 965 thousand units in 2017 to 1.2 million units in 2019. The firm’s share of the U.S. crossover market increased from 13% to 14% over the same time.
In 2019, Cadillac sold 390,000 vehicles globally (up 8.8% from 2018) compared to a more modest 156,000 vehicles sold in the U.S. (up 1% YoY). Importantly, General Motors is growing where it counts. Both full-size pickups and the Cadillac brand offer higher margins than other automobiles the firm sells.
General Motors core business is likely to continue its strong performance. Before the COVID-19 pandemic, Bloomberg New Energy Finance estimated the total passenger vehicle fleet across the globe would rise 2% compounded annually from 2019 to 2040. While a growing global market for vehicles is encouraging for General Motors’ core business, the firm is positioning itself to take advantage of growth in the electric vehicle (EV) market as well. Bloomberg New Energy Finance expects the EV market to grow by 17% compounded annually over the same time period.
General Motors Is Well-Positioned for an Electric Future
The future looks bright for electric vehicles (EVs). Global EV sales in 2021 are expected to increase 36% YoY. No doubt this optimism has helped drive Tesla’s stock price up by 263% year-to-date (YTD). While the future of EVs get many people excited about Tesla, the incumbent automakers, General Motors included, are focused on preparing for an electric future as well. General Motors’ expects to invest $20 billion (15% of 2019 revenue) in EV through 2025.
Of that investment, General Motors is spending $2.2 billion at its Detroit-Hamtramck facility to make it the firm’s first assembly plant fully devoted to EV. This facility is expected to produce a variety of pickups and SUVs with General Motors’ first all-electric pickup scheduled for production in late 2021.
Additionally, General Motors’ recent collaboration with Honda underscores the sophistication of its battery technology and EV development. Honda plans to develop two new EVs to be manufactured on General Motors’ EV platform. If GM’s EV manufacturing platform is good enough for Honda to design cars around, it’s probably a very high-quality platform for GM’s EVs as well as other car makers who are not as advanced in EV production.
EV is an opportunity for General Motors to grow market share over the long term. By planning to move 30% of its vehicles to electric motor and battery power, it has an opportunity to establish a leadership position as more consumers shift to EV. While General Motors focuses on the future, shorter-term results are sure to suffer. Nevertheless, GM enjoys the benefit of being able to enter the EV with scale. In other words, it can offer high-quality EVs at competitive prices while also turning a profit. Put another way, GM can, by itself, grow the EV market.
The push into the EV market is not just a technological difference, it is a business model shift towards the higher margin luxury market. The average car price in the U.S. in 2019 was ~$37,000 while the average EV price was just under $56,000. What the firm may lose in market share in the short term by not refreshing more of its traditional products (including foregoing much of the hybrid market), it gains in positioning itself for long-term leadership in the EV luxury market with the ability to expand into lower-priced markets as the cost of EV technology decreases.
As Costs Fall EV Adoption Will Rise
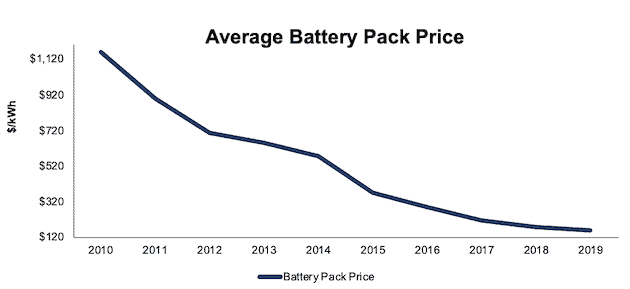
One of the largest prohibitors of the adoption of EVs is the cost. EVs’ higher costs originate from the powertrain, which includes the battery. For EVs, powertrain costs comprise 51% of total vehicle costs whereas, powertrain costs account for only 18% of internal-combustion-engine (ICE) vehicle costs. As EV powertrains become cheaper, adoption of EVs should rise.
Per Figure 3, the average battery pack price for EVs has fallen from $1,160/kWh in 2010 to just $156/kWh in 2019. For reference, EVs are forecasted to match ICE vehicles for cost parity when battery pack cost reach $80 to $100/kWh.
Figure 3: Battery Packs Are Getting Cheaper
Sources: New Constructs & BloombergNEF.
General Motors is already seeing results from its EV investments. While battery prices have been declining, General Motors new Ultium battery pack could cost as little as $120/kWh, or well below the average battery pack cost in 2019.
General Motors Will Enter the EV Market with Big-Time Scale
General Motors has manufacturing, assembly, distribution, office, or warehousing operations in 32 countries. In the U.S. alone, the company has 32 plants and facilities. General Motors uses its size to reduce the cost of implementing technological changes across different product lines in various markets.
Beyond investing in the future of vehicle production, General Motors has an advantage in scaling and monetizing its technological investments across its many established brands, supply chain, and distribution channels.
The firm has already proven its EV production capabilities with the Chevy Bolt. Since 2017, the firm has sold over 87,000 Bolts in North America and South Korea. Combining its success with the Bolt and its formidable manufacturing and distribution capabilities, GM plans to roll out its EV technology with at least 20 different EV models by 2023. For comparison, Tesla produced four models in its 1Q20 production.
The firm has shown its ability to leverage its technology across multiple models with its Cruise autonomous driving technology. For example, the firm is leveraging its Cruise technology to develop a semi-autonomous system for its passenger cars, which it calls Super Cruise. Consumer Reports ranked Super Cruise ahead of Tesla’s Autopilot system, and General Motors plans to include Super Cruise in 2021 model year Cadillacs, and up to 22 models by 2023.
On a standalone basis, GM stands to benefit from growth in the autonomous vehicle market, which MarketsandMarkets estimates will grow from just about 500 thousand units in 2025 to 6.9 million by 2030.
GM Is Undervalued
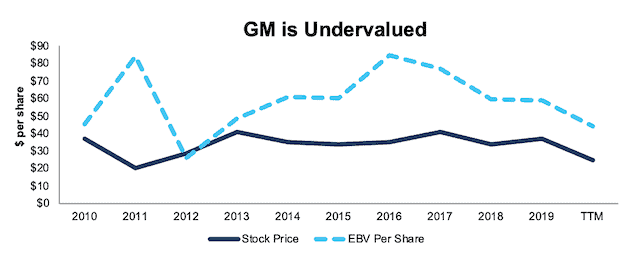
After falling 29% year-to-date (YTD) to $26/share, GM now trades significantly below its economic book value, or no-growth value, and has a price-to-economic book value (PEBV) ratio 0.6. This ratio means the market expects General Motors’ NOPAT to permanently decline by 40%. This expectation seems overly pessimistic.
General Motors’ current economic book value is $44/share – a 69% upside from the current price. We normally include excess cash in our calculation of economic book value. However, given the uncertainty created by the COVID-19 pandemic, we conservatively assume the firm will use all excess cash (valued at $28/share) to fund its operations and have removed it from our economic book value calculation in this report.
Figure 4: Stock Price vs. Economic Book Value (EBV) per Share
Sources: New Constructs, LLC and company filings.
GM’s Current Price Implies No Economic Recovery
General Motors is priced as if the COVID-driven economic decline will permanently depress its profits. Below, we use our reverse DCF model to quantify the cash flow expectations baked into General Motors’ current stock price. Then, we analyze the implied value of the stock based on different assumptions about COVID-19’s impact on the economy and General Motors’ future growth in cash flows.
Scenario 1: Using historical revenue declines, historical margins, and average historical GDP growth rates, we can model the worst-case scenario already implied by General Motors’ current stock price. In this scenario, we assume:
- NOPAT margins fall to 2.5% (all-time low in 2012, compared to 5.0% in 2019) in 2020 and improve to 4.4% (equal to TTM margins) in each year thereafter
- Revenue falls 28% in 2020 [in line with the 2020 sales decline in the first year of Boston Consulting Group’s (BCG) pessimistic scenario for China, Europe, and the U.S.A.] and do not grow through 2024 (worse than the 6% compound annual sales growth from 2020-2024 in the remaining years of BCG’s pessimistic scenario)
- Sales grow again in at 3.5% per year from 2025 and each year thereafter, which is the average global GDP growth rate since 1961
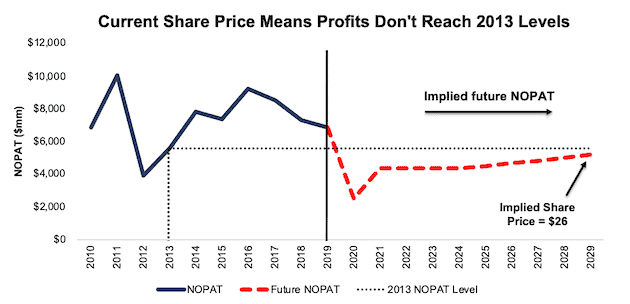
In this scenario, where General Motors’ NOPAT declines 9% compounded annually over the next decade (including an 64% YoY drop in 2020), the stock is worth $26/share today – equal to the current stock price. This scenario also accounts for the debt issuance since the end of 1Q20 noted earlier. We conservatively assume this capital will be used to cover operating expenses and do not treat it or any other cash as excess cash. See the math behind this reverse DCF scenario.
For reference, when General Motors’ European business suffered from deteriorating economic conditions in 2012, the firm’s NOPAT fell 61% YoY before growing 24% compounded annually over the following four years.
Figure 5 compares the firm’s implied future NOPAT in this scenario to its historical NOPAT. This worst-case scenario implies General Motors’ NOPAT a decade from now will be 25% below its 2019 NOPAT. In other words, this scenario implies that a decade after the COVID-19 pandemic, General Motors’ profits will have only recovered to 8% below 2013 NOPAT levels. General Motors has surpassed this profit level in nine of the last 10 years. In any scenario better than this one, GM holds significant upside potential, as we’ll show below.
Figure 5: Current Valuation Implies Severe, Long-Term Decline in Profits: Scenario 1
Sources: New Constructs, LLC and company filings.
Scenario 2: Long-term View Could Be Very Profitable
If we assume, as does the International Monetary Fund (IMF) and nearly every economist in the world, that the global economy rebounds and returns to growth starting in 2021, GM is significantly undervalued.
In this scenario, we assume:
- NOPAT margins fall to 2.5% (all-time low in 2012, compared to 5.0% in 2019) in 2020 and rise to 4.3% (vs. 4.4% TTM and below all-time average of 4.9%) each year thereafter
- Revenue falls 22% in 2020 and grows 18% in 2021, 3% in 2022, 4% in 2023, and 3% in 2024 (in line with BCG’s Most Likely II 2020-2025 sales scenario for China, Europe, and U.S.A.)
- In 2025 and each year thereafter, we assume revenue grows at 2% per year (equal to BCG’s Most Likely II scenario estimate for 2025 and below the average global GDP growth rate since 1961of 3.5%)
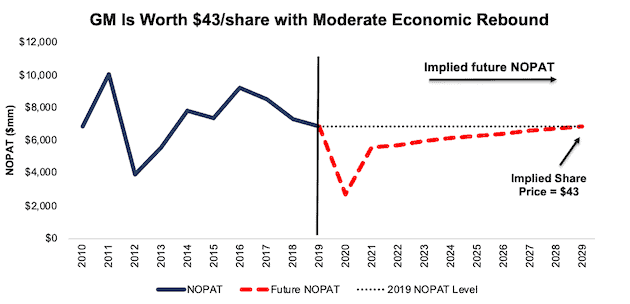
In this scenario, General Motors’ NOPAT grows by less than 1% compounded annually over the next decade (including an 61% YoY drop in 2020) and the stock is worth $43/share today – a 65% upside to the current price. This scenario also accounts for the debt issuance since the end of 1Q20 noted earlier. We conservatively assume this capital will be used to cover operating expenses and do not treat it or any other cash as excess cash. See the math behind this reverse DCF scenario.
For comparison, General Motors has grown NOPAT by 8% compounded annually over the past seven years. It’s not often investors get the opportunity to buy a growing company at such a discounted price.
Figure 6 compares the firm’s implied future NOPAT in scenario 2 to its historical NOPAT. This scenario implies that a decade from now, General Motors’ NOPAT will be at or below profit levels achieved in eight of the past 10 years. If profits return to these levels in less than 10 years, GM has even more upside potential.
Figure 6: Implied Profits Assuming Moderate Recovery: Scenario 2
Sources: New Constructs, LLC and company filings.
Analyzing the Market’s Misallocation of Capital in Auto Stocks
As we noted in our article “Micro-Bubble Winners”, the market has significantly overallocated capital to money-losing stocks and underallocated to incumbent firms generating consistent profits and cash flows. Tesla and General Motors are a perfect example of this misallocation. Despite having drastically worse cash flow and overall vehicle production numbers than General Motors, Tesla’s stock price reflects expectations for future cash flows that are drastically higher than the expectations in GM.
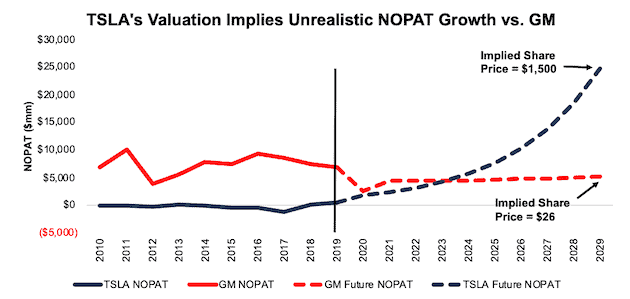
Tesla’s current valuation of $1,500/share implies the firm will grow NOPAT by 55% compounded annually for the next decade while achieving NOPAT margins of 5% (equal to the market-weighted-average of firms in Figure 2 excluding Tesla, compared to 3% TTM). In this scenario, Tesla’s NOPAT in 2029 equals $25 billion (vs. $760 million TTM). For comparison, Toyota’s, the world’s second largest (by revenue) automobile manufacturer, TTM NOPAT is just $19.4 billion. Compared to other large firms, Tesla’s implied NOPAT is greater than the TTM NOPAT of Walmart (WMT) ($16.5 billion), Amazon (AMZN) ($13.5 billion), and Facebook (FB) ($24 billion).
Furthermore, the global EV market was valued at $162 billion in 2019 and expected to reach $803 billion by 2027. To achieve its implied NOPAT level, Tesla would need to generate ~$480 billion (60% of 2027’s projected global market value) in revenue. Figure 9 contrasts expectations embedded in Tesla’s valuation with the expectations embedded in General Motors’. See the math behind Tesla’s reverse DCF scenario.
Figure 7: Tesla vs. General Motors: Historical and Implied NOPAT
Sources: New Constructs, LLC and company filings.
Sustainable Competitive Advantages Will Drive Shareholder Value Creation
Here’s a summary of why we think the moat around General Motors’ business will enable it to continue to generate higher NOPAT than the current market valuation implies. The following competitive advantages help General Motors survive the downturn and return to growth as the economy rebounds:
- Strong balance sheet to survive the economic dip
- Ability to scale its investments in driverless and EV technologies across its vast distribution capabilities
- Higher profitability than most peers
What Noise Traders Miss with General Motors
These days, fewer investors focus on finding quality capital allocators with shareholder friendly corporate governance. Instead, due to the proliferation of noise traders, the focus is on short-term technical trading trends while high-quality fundamental research is overlooked. Here’s a quick summary of what noise traders are missing:
- Growing market share of truck, crossover, and Cadillac brands
- General Motors’ technological preparedness
- Valuation implies automobile industry never recovers
Dividend Suspension Should Be Temporary
General Motors suspended its dividend and share buyback program in April to preserve liquidity. This suspension should be temporary, given General Motors’ significant cash generation. From 2015 to 2019, the firm generated more in in free cash flow ($16.4 billion) than it paid out in dividends ($11.4 billion), or an average $1.0 billion surplus each year. Its last quarterly dividend, when annualized, equaled $1.52/share and provided a 5.9% yield.
Firms with cash flows greater than dividend payments have a higher likelihood to maintain and grow dividends. While General Motors suspended its dividend in the short term, investors buying at current prices should get a nice yield with upside potential as the firm reinstates the dividend over the long term.
Historically, General Motors has also returned capital to its shareholders through share repurchases. Before suspending repurchases, General Motors repurchased $10.7 billion (30% of current market cap) over the past five years and is authorized to purchase up to ~$3.4 billion more. A return to repurchasing shares once the economy stabilizes, or even returns to growth, would provide additional yield for investors.
A Consensus Beat or Signs of Recovery Could Send Shares Higher
According to Zacks, consensus estimates at the end of January pegged General Motors’ 2020 EPS at $6.11/share. Jump forward to July 10, and consensus estimates for General Motors’ 2020 EPS have fallen to $1.51/share. 2021 estimates follow a similar trend. At the end of January, 2021 EPS consensus was $5.85/share and has since fallen to $3.92/share.
Though the COVID-19 pandemic has reduced demand for automobiles, these lowered expectations provide a great opportunity for a strong company, such as General Motors, to beat consensus. Our current Earnings Distortion Score, which is a short-term indicator of the likelihood to beat or miss expectations, for General Motors is “In-Line.”
The firm beat EPS estimates in 11 of the past 12 quarters, and doing so again, in the midst of such market turmoil, could send shares higher.
Insider Trading and Short Interest Trends
Over the past twelve months, insiders have bought a total of 1 million shares and sold 764 thousand shares for a net effect of 236 thousand shares purchased. These purchases represent less than 1% of shares outstanding.
There are currently 17.4 million shares sold short, which equates to 1.3% of shares outstanding and just over one day to cover. Short interest is down 17% from the prior month. The low and decreasing short interest shows that not many people are willing to bet against this firm.
Critical Details Found in Financial Filings by Our Robo-Analyst Technology
As investors focus more on fundamental research, research automation technology is needed to analyze all the critical financial details in financial filings as shown in the Harvard Business School and MIT Sloan paper, "Core Earnings: New Data and Evidence”.
Below are specifics on the adjustments we make based on Robo-Analyst findings in General Motors’ 2019 10-K:
Income Statement: we made $5.8 billion of adjustments, with a net effect of removing $261 million in non-operating expenses (<1% of revenue). You can see all the adjustments made to General Motors’ income statement here.
Balance Sheet: we made $89.2 billion of adjustments to calculate invested capital with a net decrease of $4.8 billion. One of the largest adjustments was $28.2 billion in asset write-downs. This adjustment represented 31% of reported net assets. You can see all the adjustments made to General Motors’ balance sheet here.
Valuation: we made $94.8 billion of adjustments with a net effect of decreasing shareholder value by $16.1 billion. Apart from total debt, the most notable adjustment to shareholder value was $18.2 billion in underfunded pensions. This adjustment represents 50% of General Motors’ market cap. See all adjustments to General Motors’ valuation here.
Attractive Funds That Hold GM
The following funds receive our Attractive-or-better rating and allocate significantly to GM:
- First Trust NASDAQ Transportation ETF (FTXR) – 7.8% allocation and Attractive rating
- Absolute Shares Trust WBI Power Factor High Dividend ETF (WBIY) – 4.8% allocation and Attractive rating
- Transamerica Large Cap Value (TWQIX) – 4.4% allocation and Very Attractive rating
- Kempner Multi Cap Deep Value Fund (FAKDX) – 3.6% allocation and Attractive rating
- Invesco Comstock Select Fund (OGRIX) – 3.5% allocation and Very Attractive rating
- Hotchkis & Wiley Large Cap Value Fund (HWLCX) – 3.0% allocation and Attractive rating
This article originally published on July 15, 2020.
Disclosure: David Trainer, Kyle Guske II, and Matt Shuler receive no compensation to write about any specific stock, style, or theme.
Follow us on Twitter, Facebook, LinkedIn, and StockTwits for real-time alerts on all our research.
[1] Our core earnings are a superior measure of profits, as demonstrated in Core Earnings: New Data & Evidence a paper by professors at Harvard Business School (HBS) & MIT Sloan. The paper empirically shows that our data is superior to “Operating Income After Depreciation” and “Income Before Special Items” from Compustat, owned by S&P Global (SPGI).

1 Response to "Making a Turn for the Better"
General Motors takes an 11% stake in Nikola, supply Nikola’s fuel cells globally, except Europe, and will produce its hydrogen fuel cel electric pickup truck by the end of 2022.
https://www.cnbc.com/2020/09/08/general-motors-takes-11percent-stake-and-2-billion-in-equity-in-electric-truck-maker-nikola-.html