
We closed this position on September 10, 2018. A copy of the associated Position Update report is here.
Check out this week’s Danger Zone interview with Chuck Jaffe of Money Life.
Investors love a good turnaround, where a struggling firm restructures to achieve newfound profit growth. Too often, during the turnaround, investors overlook issues and send shares higher regardless of signs that the turnaround is not working as expected. They get caught up in the turnaround story and don’t realize until too late that the story is untrue.
This company has executed its turnaround strategy, but the excepted results (improved profits) have failed to materialize. Instead profits continue to fall, margins lag peers, and strategic initiatives fail to deliver tangible results. Throw in an overvalued stock price and its clear why hair salon operator Regis Corporation (RGS: $17/share) is this week’s Danger Zone pick.
Profit Declines is Outpacing Revenue Decline
Since fiscal 2007, RGS’ revenue has fallen 4% compounded annually. At the same time, RGS’ after-tax profit (NOPAT) has fallen 12% compounded annually to $46 million in 2017. More recently, NOPAT has fallen from $48 million in 2015 to $26 million TTM. Meanwhile, GAAP net income has improved from -$34 million to -$7 million over the same time, per Figure 1. Investors looking solely at reported numbers would believe RGS’ profits are on the rise despite NOPAT continuing to fall.
Figure 1: RGS’ NOPAT Since 2007
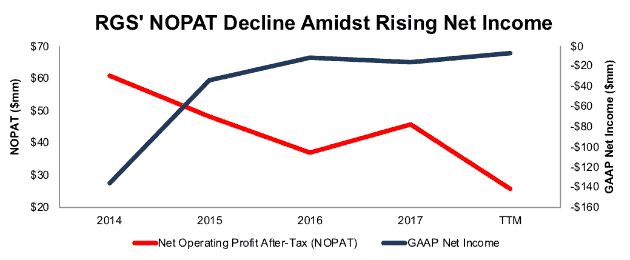
Sources: New Constructs, LLC and company filings
The rapid deterioration in NOPAT comes from NOPAT margins falling from 6% in fiscal 2007 to 2% TTM. At the same time, average invested capital turns, a measure of balance sheet efficiency, have fallen from 0.9 in 2007 to 0.6 TTM. Falling margins and inefficient capital use have dropped RGS’ return on invested capital (ROIC) down from 6% in fiscal 2007 to 1% TTM.
Compensation Plan Rewards Execs While Destroying Shareholder Value
Regis Corporation’s executive compensation plan fails to properly align executives’ interests with shareholders’ interests. The misalignment helps drive the profit decline shown in Figure 1 and enables executives to earn large bonuses while shareholder value is destroyed.
Executives’ annual bonuses are tied to cash flow per share and same store sales growth metrics. Long-term incentive compensation is awarded via time-based restricted stock units and performance stock units tied to adjusted EPS targets. Cash flow per share is calculated using adjusted EBITDA, which removes many true costs of doing business. Adjusted EPS includes many of the same adjustments as adjusted EBITDA.
The bottom line is that executives are incentivized by metrics that have allowed execs to earn bonus awards while destroying shareholder value. Since 2012, RGS’s economic earnings, the true cash flows of the business, have fallen from $23 million to -$95 million TTM. This poor capital allocation is not new either. Per Figure 2, RGS’ ROIC has been in long-term decline.
Figure 2: RGS’ ROIC Since 1998
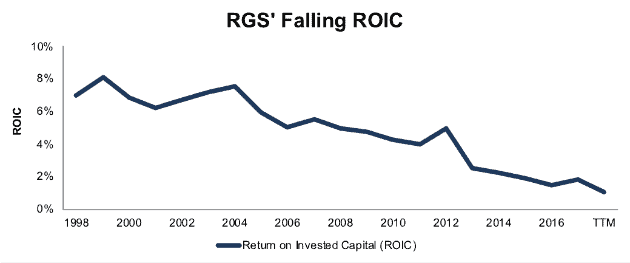
Sources: New Constructs, LLC and company filings
We’ve demonstrated through numerous case studies that ROIC, not EBITDA or adjusted EPS, is the primary driver of shareholder value creation. A recent white paper published by Ernst & Young also validates the importance of ROIC (see here: Getting ROIC Right) and the superiority of our data analytics. Without major changes to this compensation plan (e.g. emphasizing ROIC), investors should expect further value destruction.
Non-GAAP Metrics Mask Large Losses
Regis Corporation uses misleading non-GAAP metrics to mask the deterioration in the true economics of the business. Metrics used include non-GAAP operating income, adjusted EBITDA, non-GAAP gross profit, and non-GAAP net income. Our research digs deeper so our clients see through these misleading financial metrics.
The adjustments made have a large impact on the disparity between GAAP net income, non-GAAP net income, and economic earnings. In the first half of fiscal 2018, RGS removed over $34.4 million of expenses (6% of revenue) to calculate non-GAAP net income, including over $24 million in restructuring costs. In fiscal 2017, RGS removed over $18.8 million of expenses (1% of revenue) from GAAP net income to calculate non-GAAP net income. After all adjustments, RGS reported fiscal 2017 non-GAAP net income of $2.7 million. Per Figure 3, GAAP net income was -$16 million and economic earnings were -$68 million.
Figure 3: RGS’ Non-GAAP Metrics Hide Declining Economic Earnings
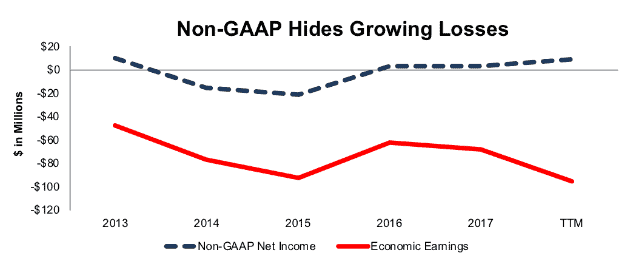
Sources: New Constructs, LLC and company filings
High Cost Structure and Low Margins Create Competitive Disadvantage
Regis Corporation owns, franchises, and operates numerous different beauty salon concepts. Brand names include SmartStyle, Supercuts, Cost Cutters, MasterCuts, and Roosters. According to Professional Consultants & Resources, a consulting firm specializing in the beauty, salon, and spa industries, there were an estimated 270,000 salons and barbershops in the U.S. in 2016. In such a highly fragmented industry, Regis faces competition from chain salons such as Great Clips, Sport Clips, or Ulta Beauty (ULTA), as well as independently owned salons or beauty products supply stores such as Sally Beauty Holdings (SBH).
By avoiding the costs of regional and national managers as well as company-wide training expenses, independent salons enjoy lower cost structures versus national chains. We do not see any benefits to the national chain or brand in the salon business. Independent salons can charge less for the same services or provide higher quality services at a similar price.
To combat this competitive disadvantage and lower its cost structure, Regis Corporation began transitioning its business away from corporate-owned stores to independently-owned franchises. However, despite a sharp increase in the percentage of franchise stores (44% of total stores in fiscal 2Q18 versus 15% in 2011), margins have only declined.
Per Figure 4, RGS’ NOPAT margin is well below the market cap weighted average of peers listed in its proxy statement. Peers include Ulta Beauty and Sally Beauty Holdings, among others.
Figure 4: RGS’ Margin Disadvantage is Growing Larger
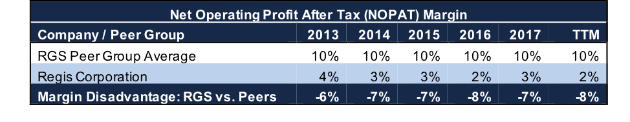
Sources: New Constructs, LLC and company filings
Bull Case Ignores Failed Turnaround and Falling Same-Store Traffic & Revenue
Over the past five years, Regis Corporation has been transitioning its business to focus on franchise stores, rather than corporate owned stores. During the transition, the company announced it would close underperforming stores to improve its portfolio of owned salons. However, bulls buying into this turnaround story are ignoring the lack of improvements in profitability that must be achieved for the turnaround strategy to work.
In 2013, franchised salons represented 28% of RGS’ store count. In the first half of fiscal 2018, franchised salons represented 44% of total store count. Over this same time, RGS shed more than 2500 corporate owned stores and total store count fell 9%. Despite the large increase in franchised salons, franchise operating income has grown only 6% compounded annually over the past three years while fees/royalties only increased from 2% of revenue in 2013 to 4% of revenue over the last twelve months. What was supposed to be a shedding of unprofitable stores and an increase in franchised stores has left RGS with a smaller revenue base, lower margins, and even lower profits.
The lack of improvement can stem from a number of factors. First, the stores being closed may not be the only underperforming stores. Second, RGS’ salon business is not achieving the sales growth needed to grow profits. Lastly, the firm’s costs are still too high in its current business model. As we’ll show below, all three factors may apply and do not appear to be abating.
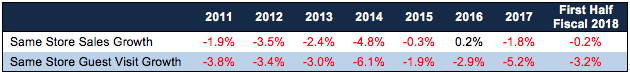
Since 2011, RGS has achieved positive same-store sales growth only once. Same-store guest visits have failed to grow year-over-year in any year since 2011, per Figure 5. No amount of store closures can stop RGS’ profit decline if same-store guest traffic is not rising and leading to increased sales, unless the firm is drastically cutting costs, which it is not.
Figure 5: RGS’ Same Store Sales and Guest Visit Growth Since 2011
Sources: New Constructs, LLC and company filings
While corporate-owned salons decreased by over 2,100 since 2015, RGS’ cost structure has not meaningfully improved. In fiscal 2015, RGS’ cost of service, cost of product, site operating expense, and rent were 85% of revenue. Over the last twelve months, these expenses have grown to 86% of revenue. In a successful turnaround, these expenses would be falling, significantly, as a percent of revenue.
Cost of service, site operating expense, and rent remain unchanged from 2015 at 48%, 10% and 17% of revenue, respectively. Cost of product increased from 10% of revenue in 2015 to 11% TTM.
Despite claims that RGS has closed underperforming stores, the cost structure of the business would imply the new store footprint is no more efficient than it was three years ago.
Even if you think this is the year Regis Corporation’s turnaround takes hold (despite fundamentals showing otherwise) such optimism is already baked into the stock price. RGS’ current valuation implies that it will immediately improve margins and grow profits at rates well above industry trends, as shown below.
RGS’ Valuation Provides Large Downside Risk
RGS shares are up 31% over the past year while the S&P is up 15%. This outperformance comes despite the deteriorating fundamentals noted earlier, as investors are willing to blindly buy into the turnaround story. However, the recent price appreciation has pushed RGS to a level where the expectations baked into the stock price are too disconnected from reality.
To justify its current price of $17/share, RGS must immediately achieve NOPAT margins of 4% (last achieved in 2013, compared to 2% TTM) and grow NOPAT by 6% compounded annually for the next 12 years. Professional Consultants & Resources estimates the entire salon industry grew by just 3.4% in 2016 (2017 data not released yet) and averaged 4% growth since 2011. Essentially, RGS must immediately end years of margin decline and grow profits well above the industry average simply to justify its current price.
Even if we assume RGS can improve margins and grow at the industry average (4% since 2011), shares hold significant downside risk. Assuming RGS achieves a 4% NOPAT margin and grows revenue by 4% compounded annually (average industry growth) for the next decade, the stock is worth only $8/share today – a 52% downside.
Each of these scenarios also assumes RGS is able to grow revenue, NOPAT and FCF without increasing working capital or fixed assets. This assumption is unlikely but allows us to create best-case scenarios that demonstrate how high expectations embedded in the current valuation are.
Is RGS Worth Acquiring?
The largest risk to any bear thesis is what we call “stupid money risk”, which means an acquirer comes in and pays for RGS at the current, or higher, share price despite the stock being overvalued. An acquisition could come from a similar beauty store operator looking to expand into the services market, or another owner of chain salons. However, these firms would be better suited to open their own salons or simply outcompete RGS rather than imprudently allocate capital and destroy substantial shareholder value in an acquisition.
We show below how expensive RGS remains even after assuming an acquirer can achieve significant synergies.
Walking Through the Acquisition Value Math
To begin, Regis Corporation has liabilities of which investors may not be aware that make it more expensive than the accounting numbers suggest.
- $757 million in off-balance-sheet operating leases (99% of market cap)
- $13 million in outstanding employee stock options (2% of market cap)
- $7 million in net deferred compensation (1% of market cap)
After adjusting for these liabilities, which make up over 100% of RGS’ market cap, we can model multiple purchase price scenarios. Even in the most optimistic of scenarios, RGS is worth less than its current share price.
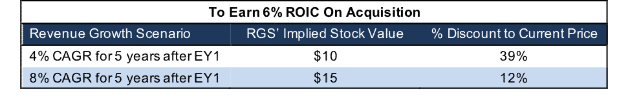
Figures 6 and 7 show what we think Ulta Beauty (ULTA) should pay for RGS to ensure it does not destroy shareholder value. While purely hypothetical, acquiring RGS could increase Ulta’s retail footprint, expand its service offerings, and create possible synergies between Ulta’s existing product sales. However, there are limits on how much ULTA would pay for RGS to earn a proper return, given the NOPAT or free cash flows (or lack thereof) being acquired.
Each implied price is based on a ‘goal ROIC’ assuming different levels of revenue growth. In both scenarios, the estimated revenue growth rate is -26% in year one, which is the consensus estimate of RGS’ revenue growth and accounts for the closing of more salons. For the subsequent years, we use 4% in scenario one because it represents a continuation of average industry growth from 2011-2016. We use 8% in scenario two because it assumes a merger with ULTA would create additional revenue opportunities through new product sales and an increased customer base.
We conservatively assume that ULTA can grow RGS’ revenue and NOPAT without spending anything on working capital or fixed assets beyond the original purchase price. We also assume RGS immediately achieves a 5% NOPAT margin, which is the average of ULTA and RGS’ NOPAT margin. For reference, RGS’ TTM NOPAT margin is 2%, so this assumption implies immediate improvement and allows the creation of a truly best-case scenario.
Figure 6: Implied Acquisition Prices for ULTA to Achieve 6% ROIC
Sources: New Constructs, LLC and company filings.
Figure 6 shows the ‘goal ROIC’ for ULTA as its weighted average cost of capital (WACC) or 6%. Even if RGS can grow revenue by 8% compounded annually, after the initial revenue drop in year 1, with a 5% NOPAT margin for the next five years, the firm is worth less than its current price of $17/share. It’s worth noting that any deal that only achieves a 6% ROIC would only be value neutral and not accretive, as the return on the deal would equal ULTA’s WACC.
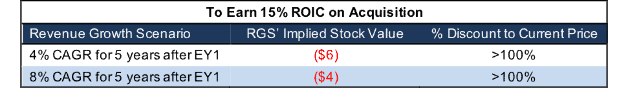
Figure 7: Implied Acquisition Prices for ULTA to Achieve 15% ROIC
Sources: New Constructs, LLC and company filings.
Figure 7 shows the next ‘goal ROIC’ of 15%, which is ULTA’s current ROIC. Acquisitions completed at these prices would be truly accretive to ULTA shareholders. Even in the best-case growth scenario, the implied stock value fails to reach $0/share, largely because of RGS’ large liabilities noted earlier. Even assuming this best-case scenario, ULTA would destroy over $1.7 billion by purchasing RGS at its current valuation. Any scenario assuming less than 8% compound annual growth in revenue would result in further capital destruction for ULTA.
Earnings Miss Could Send Shares Lower
As RGS’ turnaround story continues to produce declining profits and slim margins, an earnings miss could be the catalyst to send shares lower. Past earnings misses have sent shares lower. In fiscal 1Q16, RGS fell 15% the day of earnings. Then in 2Q17, RGS fell 10% in the day before and after earnings. In each instance, RGS missed both top and bottom line expectations. RGS has a long history of missing revenue expectations and a checkered past in regards to EPS expectations.
Rising expectations could now be setting the firm up for another miss and subsequent share price cut. 2018 EPS estimates have increased from $0.19/share to $0.37/share over the past six months. Such an increase seems to contradict the company’s TTM results, which show lower profitability and little evidence of a successful turnaround.
Should such a miss occur, shares could see a fall similar to fiscal 1Q16, as investors long believing in the turnaround story decide to dump shares. While we don’t attempt to predict exactly when the market will recognize the disconnect between expectations and reality, the ensuing share collapse could hurt investors’ portfolios.
Insider Trading and Short Interest Are Minimal
Over the past 12 months, 282 thousand insider shares have been purchased and 43 thousand have been sold for a net effect of 239 thousand insider shares purchased. These purchases represent less than 1% of shares outstanding.
Short interest is currently 2.2 million shares, which equates to 5% of shares outstanding and 20 days to cover. Should same store sales continue to decline, short interest could grow larger.
Auditable Impact of Footnotes & Forensic Accounting Adjustments[1]
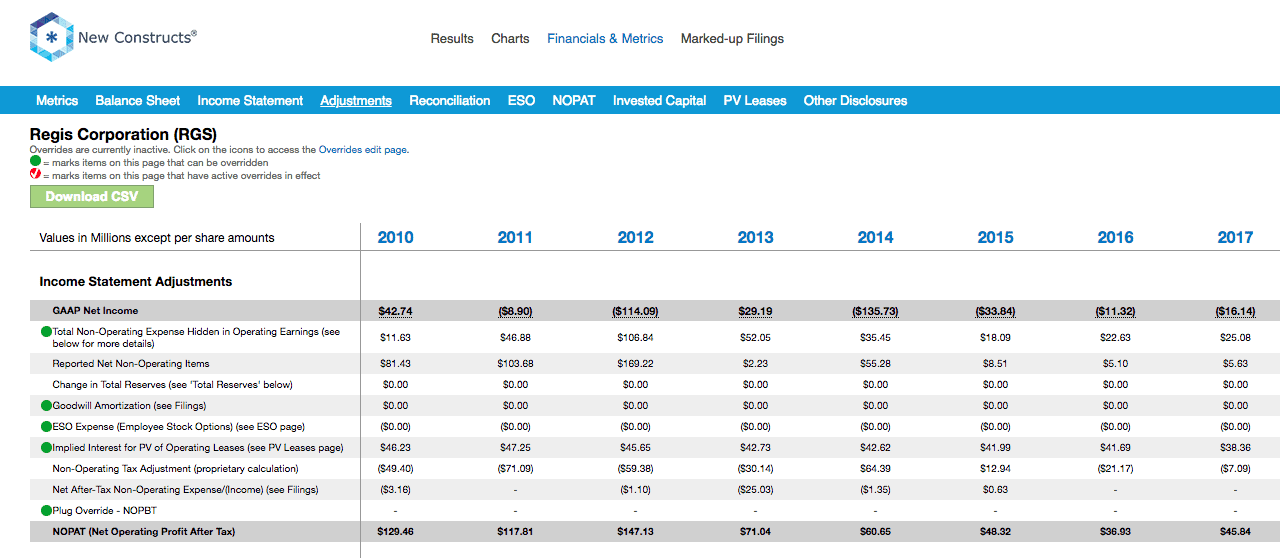
Our Robo-Analyst technology enables us to perform forensic accounting with scale and provide the research needed to fulfill fiduciary duties. In order to derive the true recurring cash flows, an accurate invested capital, and an accurate shareholder value, we made the following adjustments to Regis Corporation’s 2017 10-K:
Income Statement: we made $84 million of adjustments, with a net effect of removing $62 million in non-operating expense (4% of revenue). We removed $11 million in non-operating income and $73 million in non-operating expenses. You can see all the adjustments made to RGS’ income statement here.
Balance Sheet: we made $1.8 billion of adjustments to calculate invested capital with a net increase of $1.6 billion. One of the largest adjustments was $773 million in asset write-downs. This adjustment represented 93% of reported net assets. You can see all the adjustments made to RGS’ balance sheet here.
Valuation: we made $989 million of adjustments with a net effect of decreasing shareholder value by $807 million. The largest adjustment to shareholder value was $878 million in total debt, which includes $757 million in off-balance sheet operating leases. This lease adjustment represents 99% of RGS’ market cap.
Unattractive Funds That Hold RGS
The following funds receive our Unattractive-or-worse rating and allocate significantly to Regis Corporation.
- CRM Small Cap Value Fund (CRMSX) – 4.1% allocation and Very Unattractive rating
- Brown Advisory Small Cap Fundamental Value Fund (BAUAX) – 1.7% allocation and Unattractive rating
This article originally published on February 20, 2018.
Disclosure: David Trainer, Kyle Guske II, and Sam McBride receive no compensation to write about any specific stock, style, or theme.
Follow us on Twitter, Facebook, LinkedIn, and StockTwits for real-time alerts on all our research.
[1] Ernst & Young’s recent white paper, “Getting ROIC Right”, proves the superiority of our research and analytics.
Click here to download a PDF of this report.
Photo Credit: Pixabay (Pexels)