We closed this position on August 13, 2021. A copy of the associated Position Update report is here.
Check out this week’s Danger Zone interview with Chuck Jaffe of Money Life.
As the Redfin (RDFN: $13/share) IPO approaches, investors must decide whether the firm is a traditional real estate brokerage or a technological innovator likely to disrupt the traditional real estate brokerage market. RDFN currently looks like a traditional brokerage and generates roughly 90% of its revenue from traditional commissions. The company’s ultimate mission is to revolutionize the way American’s buy and sell their home by leveraging technology to lower costs and provide a smoother, faster real estate transaction process.
Will the tech focus be enough to set RDFN apart in the fragmented residential brokerage market? Can RDFN become to the residential brokerage market what Amazon is to retail? While we are far from convinced, there may be enough market participants that will answer “yes” to keep this IPO from coming out of the gate like Snapchat (SNAP) or Blue Apron (APRN). However, investors considering jumping in should exercise caution, and realize that the traditional brokerage vs. tech company question is already being answered by the IPO valuation.
For the company to succeed longer term, it needs a tech company valuation to access the capital required to fund its current cash burn and future investments. Further, the road to taking the market share necessary to justify today’s valuation is likely a long one. In light of its optimistic valuation and the downside risk associated with the business ultimately being viewed as a traditional real estate brokerage with fancy apps, the upcoming Redfin (RDFN) IPO is in the Danger Zone this week.
Investments in Technology to Drive Additional Losses
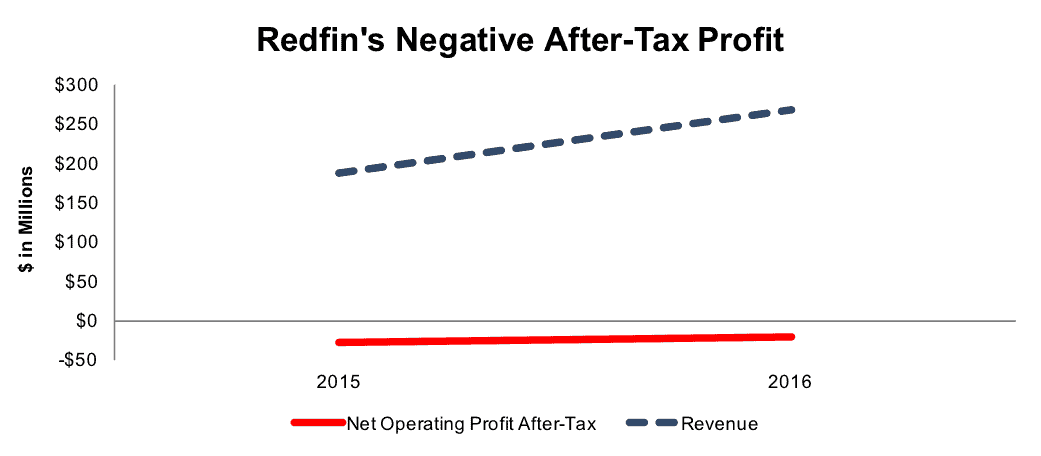
Per Figure 1, Redfin’s revenue grew an impressive 43% year-over-year in 2016. Meanwhile, net operating profit after-tax (NOPAT) slightly improved from -$28 million in 2015 to -$21 million in 2016. Despite the narrower loss in 2016, RDFN is not likely on a path to profitability in the foreseeable future. In fact, we would not be surprised to see losses widening following the IPO as the fresh cash is used to fund investments in the company’s real estate technology platform.
Figure 1: Redfin’s Profitless Revenue Growth
Sources: New Constructs, LLC, and company filings
Redfin has a NOPAT margin of -8% and earns a bottom-quintile return on invested capital (ROIC) of -17%. The company burned through $57 million in free cash flow (FCF) in 2016. Not surprisingly, the upcoming IPO comes at a time when Redfin most needs cash to keep the business running. The company’s $66 million in cash currently on the books would only support the 2016 cash burn rate for just over one year. The IPO proceeds will position the company to invest heavily for the next 3-4 years.
On a GAAP basis, RDFN’s profitability looks no better. Redfin’s GAAP net loss of -$28 million in 1Q17 was greater than its GAAP net loss for all of 2016. As Redfin expands into the mortgage and title businesses, the company’s losses have increased.
Losses could get worse before they get better. However, RDFN could prove to be another company where losses are forgiven by the market so long as the company maintains its revenue growth trajectory.
Limited Exec Comp Disclosure Raises Red Flags
As an “emerging growth company,” Redfin faces less strict reporting standards (more on these issues below), particularly in regards to executive compensation. However, information the company does provide suggests that Redfin’s executive compensation plan fails to properly align executive interests’ with shareholders’ interests’.
Apart from base salaries, executives are eligible for non-equity performance compensation. The metrics used to determine these bonuses include revenue, year-over-year revenue targets, customer satisfaction, the number of monthly average visitors to Redfin’s site, and gross margin in certain markets. Equity awards were given at the discretion of the board of directors. Unfortunately, none of these metrics properly incentive executives and could lead to large bonuses while shareholder value is destroyed.
We’ve demonstrated through numerous case studies that ROIC is the primary driver of shareholder value creation. Without changes to this compensation plan (e.g. emphasizing ROIC), investors remain exposed to the potential for executives to enrich themselves while destroying shareholder value.
Unique Non-GAAP Metrics Raise More Red Flags
Redfin forgoes the use of common non-GAAP metrics such as adjusted EBITDA or non-GAAP net income, which often mask the true economics of the business. However, Redfin’s non-GAAP metrics direct investor attention even farther away from the economics of the business than common non-GAAP metrics. The fact that management uses Redfin’s “Key Business Metrics” to evaluate the business, develop financial forecasts, and make strategic decisions means the people running the business may have no regard for the economics of the business. Redfin’s “Key business metrics” include:
- Monthly average visitors
- Real estate transactions
- Real estate revenue per real estate transactions
- Aggregate home value of real estate transactions
The focus on the top-line, and omission of the bottom line is the largest flaw in each of these metrics. Redfin can tout “record performance” in real estate transactions, but if the cost of completing a sale rises just as fast, the firm’s profitability will continue to lag.
Competition From Brokerages & Tech Firms Makes RDFN Gamble a Risky One
RDFN management is positioning the company as a better version of Zillow with transactional capabilities rather than a traditional brokerage such as Realogy (RLGY). While RDFN falls somewhere between the two, it’s clear that the firm represents one of an estimated 86,000 real estate brokerages in the United States. Residential brokerage is a highly-fragmented industry with low barriers to entry, which makes RDFN’s large bet on the industry a risky one.
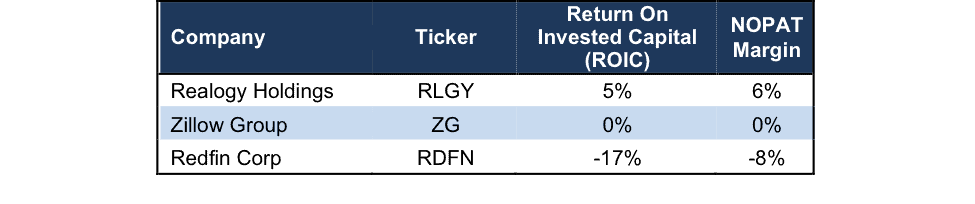
Despite RDFN’s claims to be a tech company, the firm derives substantially all its revenue from commissions on home sales. Being reliant on commission revenue pits RDFN against other brokerages such as Keller Williams, HSF Affiliates (which operates Berkshire Hathaway HomeServices), and Realogy Holdings (RLGY), which operates Century 21, Coldwell Banker and ZipRealty. The online nature of RDFN’s business will also draw comparisons to Zillow Group (ZG), a firm we placed in the Danger Zone in early 2016. Per Figure 2, Redfin’s -8% NOPAT margin and -17% ROIC rank well below its competition.
Figure 2: Redfin’s Negative Profitability Lags The Competition
Sources: New Constructs, LLC and company filings
These lower margins can be partially attributed to RDFN’s business model, which employs agents rather than maintaining them as independent contractors. This business model means RDFN incurs employment costs that traditional brokerages avoid. Similarly, RDFN’s model of charging sellers with a commission 100 to 150 basis points below traditional brokerages results in agents earning less per transaction.
However, RDFN agents are currently more productive than the average agent and make up the difference on volume, presumably with the aid of RDFN’s tech platform. While not an issue at RDFN’s current size, this model could negatively impact RDFN’s ability to attract and retain top agent talent. Margins could be further diminished were the company forced to raise compensation to attract such talent.
How Much Market Share Does RDFN Have to Gain?
Existing homes currently sell at a rate of 5.5 million annually. Every transaction has two sides (buy/sell) meaning the brokerage market has 11 million transactions annually. The total transaction value market for brokers is about $1.5 trillion annually, at roughly $255k per sale. In 2016 RDFN estimated the commission pool at $75 billion, or 5% of $1.5 trillion.
Realogy is the dominant market player with 13% share in total transaction volume (1.5mm out of 11mm) and roughly 30% share of total transaction value based on a $325k average sales price. In 2016 RDFN had 0.25% market share in total transaction volume and 1.5% market share in total transaction value based on a $600k average sales price. RDFN’s average sales price will fall towards RLGY’s as the company expands geographically.
To justify the IPO valuation, we estimate RDFN has to approach at least 2.0% market share in total transaction volume (from 0.25%) and 5.0% market share of total transaction value (from 1.5%). While these market share numbers do not appear impossible, market share movement likely will be very gradual. The highly fragmented residential brokerage market has 86,000 competing firms, the bulk of which have a local or regional focus. The only example of national franchise that has successfully captured a large, national market share position is Realogy (RLGY). RLGY did so by consolidating three large and well established brands: Coldwell Banker (founded 1906), Century 21 (1971) and ERA (1972).
Recreating this roll-up strategy is not an option for RDFN given that firms like Coldwell Banker, Century 21 and ERA built their businesses over the past 50-100 years and comparable firms available to acquire do not exist today. Further, we think achieving just the 2% market share already baked into the IPO valuation is not possible in part due to the fragmented nature of the residential brokerage market, but also economics of doing so. To greatly increase its market share, RDFN must invest heavily in new markets or existing markets, with little capital flexibility and negative margins. Fearing a loss in market share, competitors could simply lower fees or outspend in marketing, while remaining profitable.
During 2016, RDFNs share of total transaction volume increased from 0.18% to 0.25% and their share of total transaction value share increased from 1.21% to 1.47%. At those rates of change it would take over 20 years to gain the needed market share. RDFN must increase the rate of market share growth or create products the company does not yet offer to grow revenue in some way besides commissions.
Housing Market Could Also Provide Unique Challenges
As noted when we featured homebuilder NVR Inc. (NVR) as a Long Idea in April 2017, the housing market has ample room for expansion. However, the economic data suggest that new homes are on the rise, while existing home sales remain supply challenged. At the end of 2016, existing inventory of homes for sale reached the lowest levels since 1999. As of May 2017, the existing inventory of homes for sale was 1.9 million, which is still down from 3 million in 2011.
Such low supply is driving up prices and threatening the long-term affordability of existing homes. If housing prices continue to rise, at an “unsustainable pace,” according to the National Association of Realtors’ chief economist, consumers’ ability to purchase homes will be diminished. In such a scenario, competition for customers would rise as less homes are available to sell and Redfin could be required to spend more to attract customers and therefore harm its already negative margin.
Redfin’s geographic concentration creates an additional challenge to its future growth prospects. In 2016, 72% of Redfin’s real estate revenue was derived from the firm’s top-10 markets, which include Boston, Chicago, Los Angeles, Maryland, Seattle, and San Francisco among others. These housing markets are among some of the most expensive in the country. In fact, six of Redfin’s top-10 markets rank amongst the Top 15 highest metro area median prices for single family homes, as measured by the National Association of Realtors.
Redfin states that its revenue and gross margin are generally higher in these markets than in smaller markets. Essentially, despite operating heavily in the most profitable housing markets in the country, Redfin’s margins remain negative. Were Redfin to expand into smaller markets in an effort to grow market share, margins could further deteriorate.
In either situation, a supply strained housing market or costly geographic expansion, we find it hard to believe Redfin can achieve the expectations implied by its expected valuation.
How Overvalued Is RDFN? See What A $1 Billion Valuation Implies
Below, we model three scenarios for the future cash flow performance baked into the midpoint of RDFN’s IPO valuation. As we show below, the expectations baked into the stock price are quite optimistic. One stumble by the company, especially disappointing revenue growth, would likely put the stock under significant pressure.
- Zillow With a Brokerage Segment: This scenario implies that Redfin operates much like Zillow, the online home-listing site, with a brokerage segment providing more than just data to consumers. To justify its current valuation in this scenario, Redfin must immediately achieve a 1% NOPAT margin (compared to -8% in 2016), which is higher than Zillow’s margin (-0.4%) and grow revenue by 31% compounded annually for the next 15 years. In this scenario, Redfin would be generating $15.6 billion in revenue (15 years from now), which is 18 times Zillow’s 2016 revenue and nearly three times Realogy Holdings 2016 revenue.
- A Traditional Brokerage: This scenario implies that Redfin can be significantly more profitable than Zillow and operate much like a traditional brokerage, with higher margins and lower revenue growth rates. To justify its current valuation in this scenario, Redfin must immediately achieve a 6% NOPAT margin, which is equal to Realogy’s TTM NOPAT margin, and grow revenue by 21% compounded annually for 9 years. In this scenario, Redfin would be generating $1.4 billion in revenue (9 years from now), which is nearly double Zillow’s 2016 revenue.
- Brokerage Fueled by Technology: This scenario implies that Redfin is able to leverage its technology to attract customers, provide better home recommendations, and ultimately sell homes at a higher margin than a traditional brokerage. To justify its current valuation in this scenario, Redfin must immediately achieve a 10% NOPAT margin (compared to -8% in 2016) and grow revenue by 20% compounded annually for the next six years.
It’s also worth noting that each of these scenarios assumes Redfin is able to grow revenue and NOPAT/free cash flow without increasing working capital or investing in fixed assets. This assumption is unlikely but allows us to create very optimistic scenarios that demonstrate how high expectations in the current valuation are. For reference, Redfin’s invested capital grew $36 million from 2015-2016.
Is RDFN Worth Acquiring?
The largest risk to any bear thesis is what we call “stupid money risk”, which means an acquirer comes in and pays for RDFN at the current, or higher, share price despite the stock being overvalued. The likelihood of an acquisition coming so close to IPO date remains small, although it has happened before. In January 2017, just one day before the planned IPO, AppDynamics was acquired by Cisco. Within the highly fragmented real estate brokerage industry, we see an acquisition as possible only if an acquiring firm is willing to ignore prudent stewardship of capital and destroy substantial shareholder value. We show below how expensive RDFN remains even after assuming an acquirer can achieve significant synergies.
Walking Through the Acquisition Value Math
To begin, Redfin has liabilities of which investors may not be aware that make it more expensive than the accounting numbers suggest.
- $90 million in outstanding employee stock options (9% of expected market cap)
- $42 million in off-balance-sheet operating leases (4% of expected market cap)
After adjusting for these liabilities, we can model multiple purchase price scenarios. Even in the most optimistic of scenarios, Redfin is worth no more than the high end of its IPO price range.
Figures 3 and 4 show what we think Realogy Holdings (RLGY) should pay for Redfin to ensure it does not destroy shareholder value. Realogy could immediately integrate Redfin’s customer search and online data into its existing real estate offerings and provide additional resources to agents. However, there are limits on how much RLGY would pay for RDFN to earn a proper return, given the NOPAT or free cash flows being acquired.
Each implied price is based on a ‘goal ROIC’ assuming different levels of revenue growth. In both scenarios, the estimated revenue growth rate in year one equals 43%, which equals Redfin’s revenue growth rate in 2016. For the subsequent years, we use 23% in scenario one because it represents the average revenue growth rate between Realogy and Redfin. We use 23% in scenario two, and grow revenue 5% each year thereafter, which assumes a merger with RLGY could create long-term revenue growth through data and agent integration.
We conservatively assume that Realogy can grow Redfin’s revenue and NOPAT without spending anything on working capital or fixed assets beyond the original purchase price. We also assume Redfin immediately achieves a 6% NOPAT margin, which is equal to Realogy’s current NOPAT margin. For reference, Redfin’s current NOPAT margin is -8%, so this assumption implies immediate improvement and allows the creation of a truly best-case scenario.
Figure 3: Implied Acquisition Prices For RLGY To Achieve 5% ROIC
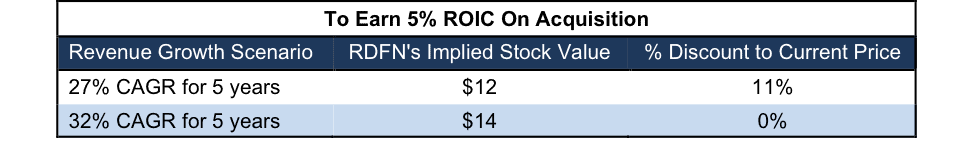
Sources: New Constructs, LLC and company filings.
Figure 3 shows the ‘goal ROIC’ for RLGY as its weighted average cost of capital (WACC) or 5%. Even if RDFN can grow revenue by 32% compounded annually with a 6% NOPAT margin for the next five years, the firm is worth no more than the high end of its price range, or $14/share. It’s worth noting that any deal that only achieves a 5% ROIC would be only value neutral and not accretive, as the return on the deal would equal RLGY’s WACC.
Figure 4: Implied Acquisition Prices For RLGY To Achieve 6% ROIC
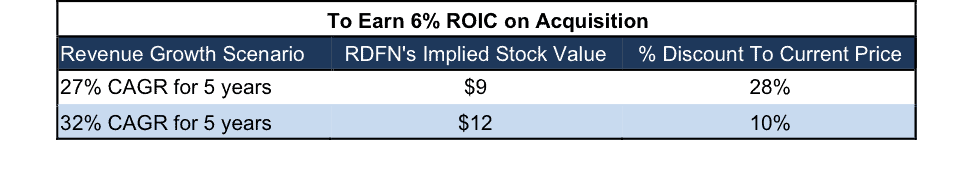
Sources: New Constructs, LLC and company filings.
Figure 4 shows the next ‘goal ROIC’ of 6%, which is slightly higher than RLGY’s current ROIC of 5%. Acquisitions completed at these prices would be truly accretive to RLGY shareholders. Even in the best-case growth scenario, the most RLGY should pay for Redfin is $12/share (10% downside to midpoint of IPO price range).
Post IPO Reality Could Set Shares Up for Failure
Ultimately, the success of the RDFN IPO will be determined by its ability to convince investors it’s a tech firm (like Zillow), rather than a traditional brokerage. As Robert Hahn, a consultant at 7DS Associates, puts it, “if Redfin is a brokerage, making $256 million in revenues and losing tens of millions every year, it’s worth zip. Zilch. Zero. Nada.”
However, the tech comparison means the company will face competition from other tech firms, and one firm looms large, Amazon. As Amazon moves into multiple segments beyond e-commerce, it’s worth watching a recent development. Geekwire reports that a new placeholder page has appeared on Amazon that says “Hire a Realtor” and allows users to enter their zip code. The new page raises the question of whether or not Amazon is entering the real estate referral business. We’ve seen the effect Amazon can have on an IPO in the recent past. Blue Apron (APRN) slashed its IPO price on the heels of Amazon’s acquisition of Whole Foods and now trades below its IPO price after it was revealed Amazon was entering the meal-kit business.
Lastly, RDFN is already priced to perfection as we’ve shown above. If RDFN fails to gain market share or create new revenue-generating products and services (such as mortgage, title, relocation services, etc,) the lofty valuation will come down. Tech company or not, the risk/reward profile on RDFN skews heavily towards risk right out of the gate.
More Disclosure Red Flags: Limited and Conflicted Disclosure Under the JOBS Act
Under the JOBS Act, any company with gross revenues below $1 billion is subject to less stringent reporting requirements. “Emerging growth” companies, such as Redfin, receive the following disclosure “benefits”:
- Underwriters participating in the IPO are allowed to publish research reports and make public appearances regarding the company. Look no further than Snap’s recent IPO for a cautionary tale on sell side ratings, particularly those coming from an underwriter.
- Following the IPO, Redfin is not required to have an independent accounting firm audit the effectiveness of the company’s internal control over financial reporting.
- Only two years of audited financial statements (compared to three for other companies) are required to be provided to investors.
- Only scaled executive compensation information for three executives is required and a compensation discussion & analysis is not necessary.
- The exemption from detailed compensation disclosure continues post-IPO and the newly public company is not required to hold “say-on-pay” voting for their executive compensation arrangements.
These benefits provided to smaller companies are not benefits to investors by any stretch. Rather, they look more like benefits to underwriters. These minimized disclosure requirements reduce transparency and make it particularly difficult to determine whether executive interests’ are properly aligned with shareholder interests’.
Impact of Footnotes Adjustments and Forensic Accounting
Our Robo-Analyst technology enables us to perform forensic accounting with scale and provide the research needed to fulfill fiduciary duties. In order to derive the true recurring cash flows, an accurate invested capital, and an accurate shareholder value, we made the following adjustments to Redfin’s S-1:
Income Statement: we made less than $3 million of adjustments with a net effect of removing $2 million in non-operating expense (1% of revenue). We removed less than $1 million related to non-operating income and $2 million related to non-operating expenses. See all the adjustments made to RDFN’s income statement here.
Balance Sheet: we made $60 million of adjustments to calculate invested capital with a net increase of $24 million. The most notable adjustment was $42 million (42% of reported net assets) related to operating leases. See all adjustments to RDFN’s balance sheet here.
Valuation: we made $132 million of adjustments with a net effect of decreasing shareholder value by $132 million. There were no adjustments that increased shareholder value. The largest adjustment to shareholder value was $90 million related to outstanding employee stock options. This adjustment represents 9% of RDFN’s expected market valuation.
This article originally published on July 24, 2017.
Disclosure: David Trainer, Kyle Guske II, and Kenneth James receive no compensation to write about any specific stock, style, or theme.
Follow us on Twitter, Facebook, LinkedIn, and StockTwits for real-time alerts on all our research.
1 Response to "Brokerage or Tech Firm? Redfin’s Valuation Requires the Latter"
It was the first company I’ve ever seen in the pre-ipo stage that DIDN’T add back stock based compensation to get to an adjusted earnings figure they pointed investors towards.