We closed this position on July 20, 2021. A copy of the associated Position Update report is here.
Check out this week’s Danger Zone interview with Chuck Jaffe of Money Life and Marketwatch.com
Acquisitions can boost accounting earnings while destroying shareholder value, a fact illustrated by the high-low fallacy. This week’s Danger Zone pick began a large acquisition spree in 2012, which continued through 2015. On the surface, everything seems on the up and up. However, when we peer below the surface, we find that the fundamentals of the business are headed in the wrong direction. For this reason and more, ACI Worldwide (ACIW: $21/share) not only landed on June’s Most Dangerous Stocks list, but is this week’s Danger Zone pick.
Acquisitions Have Destroyed Shareholder Value
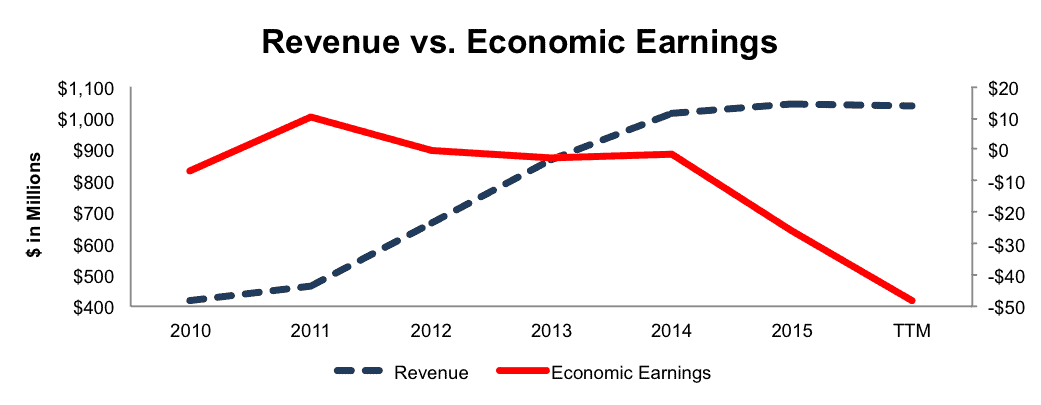
Since 2012, ACI Worldwide has completed eight separate acquisitions at a cumulative cost of $1.4 billion. These acquisitions stoked revenue, which grew 22% compounded annually from 2011-2015. However, these acquisitions came at the expense of economic earnings, the true cash flows of the business, which declined from $10 million in 2011 to -$26 million in 2015. Economic earnings have fallen even further, to -$48 million, over the trailing twelve months (TTM). Figure 1 shows the divergence of revenue and economic earnings. See the reconciliation of ACI Worldwide’s GAAP net income to economic earnings here.
Figure 1: Disconnect Between Revenue and Economic Earnings
Sources: New Constructs, LLC and company filings
These acquisitions have been an inefficient use of capital. ACI Worldwide’s return on invested capital (ROIC) has fallen from 11% in 2011 to a bottom-quintile 4% over the last twelve months. Worse yet, ACI Worldwide’s total debt, which includes off-balance sheet operating leases, has grown from $128 million in 2011 to $825 million (34% of market cap) TTM.
Non-GAAP Earnings Overstate Business Operations
Investors must be aware of the dangers of non-GAAP earnings as they routinely remove standard costs of doing business, thereby creating a more positive picture of business operations. Here are expenses ACIW has removed when calculating its non-GAAP metrics, including non-GAAP revenue, non-GAAP operating income, adjusted EBITDA, and non-GAAP net income:
- Employee related actions
- Facility closure expenses
- Professional fees
- Data center move expenses
- Transition and technology costs
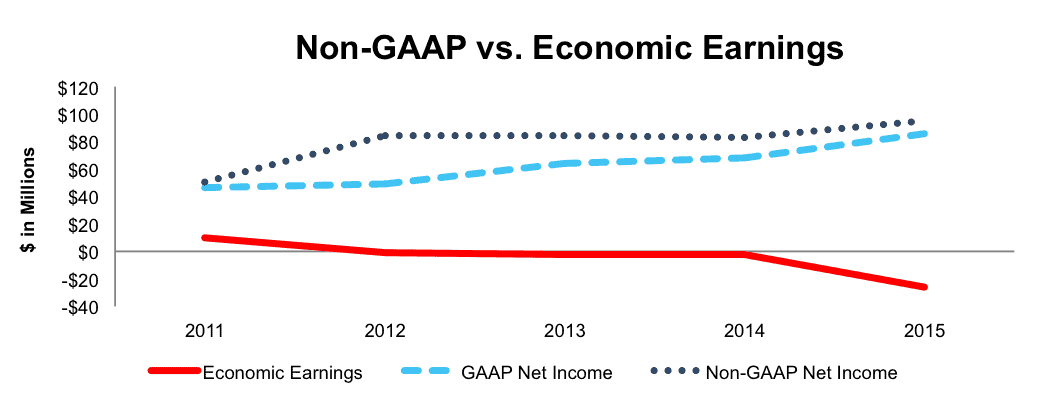
By removing these costs, ACIW is able to report non-GAAP results that are better than the company’s true profits. While non-GAAP and GAAP net income grew in 2015 year-over-year, ACIW’s after-tax profit (NOPAT), the normal, after-tax cash flow, declined 17% to $96 million. TTM NOPAT has fallen even further, to $78 million.
Longer-term, ACIW’s non-GAAP net income has grown from $50 million in 2011 to $95 million in 2015. In contrast, economic earnings have declined from $10 million in 2011 to -$26 million in 2015, per Figure 2.
Figure 2: ACI Worldwide’s Non-GAAP Overstates Profits
Sources: New Constructs, LLC and company filings
Negative Profitability Creates Competitive Disadvantages
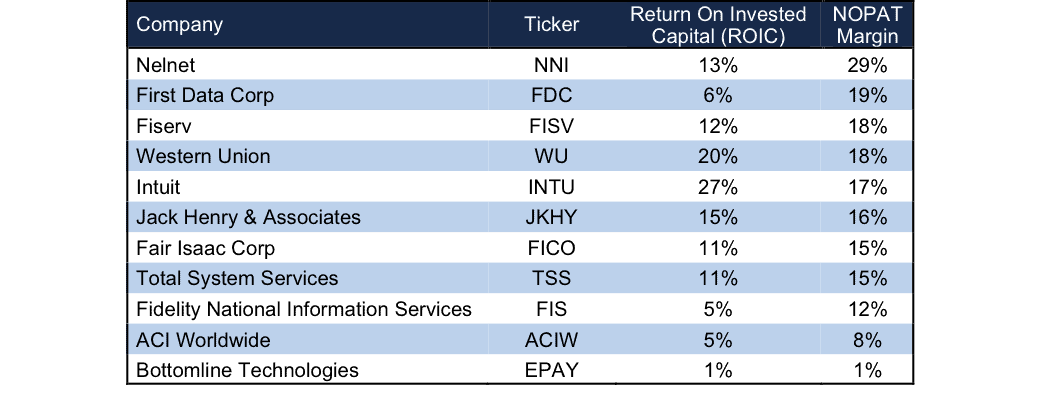
The payment and banking market is highly competitive and ACIW identifies several competitors across each of its business segments. As noted in the company’s 10-K, competition comes from First Data Corp (FDC), Fiserv (FISV), Jack Henry & Associates (JKHY), Nelnet (NNI), and Western Union (WU), among others. These competitors are in addition to private service providers and in-house technology departments of potential customers. Per Figure 3, it is clear that much of the competition ACIW faces have higher margins and ROICs. ACIW recognizes that competitive factors in the market include price and commitment to continued R&D. However, having a lower margin and ROIC than most of its competition means that ACIW has less price flexibility and could also mean the firm has less ability to invest in R&D to improve its offerings.
Figure 3: ACIW’s Profitability Lags Behind Competition
Sources: New Constructs, LLC and company filings
Bull Hopes Rest On Optimistic Assumptions Regarding Backlog Value
As revenue growth has slowed since 2014, as can be seen in Figure 1, bulls are left with few options: rely on ACIW’s ability to grow without acquisition and/or believe that the acquisitions will start adding economic value in the near future. Unfortunately for investors, growth without acquisition has been hard to come by, as the company’s TTM revenue is only marginally higher than 2014 revenue and organic revenue growth has been in the low single digits or, worse yet negative, as it was in 2014. Consensus estimates for revenue do not point to much of an improvement.
Buying into the potential profits windfalls from the recent acquisitions requires large assumptions, ones that are no sure bet. Specifically, we’re talking about ACIW’s 60-month backlog, which is essentially ACIW’s expected revenue over the next 60-months from existing contracts. We previously saw a backlog valuation prop up SolarCity’s (SCTY) stock’s valuation when analyzing its “retained value” metric. Though the business models are different, both backlogs require optimistic assumptions to justify their value.
Specifically, the key assumptions for ACIW’s 60-month backlog include:
- Maintenance fees are assumed to exist for duration of license term, even if committed maintenance term is less than license term.
- Non-recurring license agreements are assumed to renew as recurring revenue streams.
- Foreign currency exchange rates are assumed to remain constant over the 60-month period
- Pricing policies and practices are assumed to remain constant
- License, facilities management and software hosting are assumed to renew at the end of their committed term at a rate consistent with historical experiences.
While on their own, each assumption may not be hard to trust. But, bulls are taking a lot of risk that all assumptions will hold true over such an extended time. If the backlog is overstated, the future profitability of ACIW could be viewed much lower, which likely hurt the stock. As we’ll show below, the current valuation implies revenue and profit growth much faster than what has occurred in the past and well above consensus expectations.
Acquisition Hopes Rest On Overpayment
The biggest risk to our thesis is that a larger competitor acquires ACIW at a value at or above today’s price. As we’ll show below, unless a competitor is willing to destroy shareholder value, an acquisition at current prices would be unwise.
We don’t think ACIW is an attractive acquisition target at its current price. To begin, ACIW has liabilities that investors may not be aware of that make it more expensive than the accounting numbers suggest.
- $72 million in off-balance-sheet operating leases (3% of market cap)
- $39 million in outstanding employee stock options (1% of market cap)
After adjusting for these liabilities we can model multiple purchase price scenarios. Unfortunately for investors, only in the most optimistic of scenarios is ACIW worth more than the current share price.
Figures 4 and 5 show what we think Fiserv (FISV) should pay for ACIW to ensure the deal is truly accretive to ACIW’s shareholder value. Fiserv could be a potential acquirer of ACI Worldwide to jump-start its software as a service offerings and boost its cross-selling opportunities within the financial services and payments market. However, there are limits on how much FISV would pay for ACIW to earn a proper return, given the NOPAT or free cash flows being acquired.
Each implied price is based on a ‘goal ROIC’ assuming different levels of revenue growth; 4%, 7%, and 10%. These revenue levels are equal to or higher than the consensus estimate for 2017 (4%). In each scenario, we conservatively assume that Fiserv can grow ACIW’s revenue and NOPAT without spending on working capital or fixed assets. We also assume ACIW achieves a 14% NOPAT margin. This margin is nearly double ACIW’s current margin and slightly below FISV’s NOPAT margin, which is boosted by its Financials segment. ACIW’s current NOPAT margin is 7.5%
Figure 4: Implied Acquisition Prices For FISV To Achieve 7% ROIC
Sources: New Constructs, LLC and company filings.
Figure 4 shows the ‘goal ROIC’ for FISV as its weighted average cost of capital (WACC) or 7%. Only if ACI Worldwide can grow revenue 10% compounded annually with a 14% NOPAT margin for the next five years is the firm worth more than its current price of $21/share. For reference, consensus estimates expect ACI Worldwide’s revenue to decline in 2016 and grow by 4% in 2017. We include the 10% scenario to provide a best-case view. Note that any deal that only achieves a 7% ROIC would be only value neutral and not accretive, as the return on the deal would equal FISV’s WACC.
Figure 5: Implied Acquisition Prices For FISV To Achieve 12% ROIC
Sources: New Constructs, LLC and company filings.
Figure 5 shows the next ‘goal ROIC’ of 12%, which is Fiserv’s current ROIC. Acquisitions completed at these prices would be truly accretive to FISV shareholders. Even in the best-case growth scenario, the most FISV should pay for ACIW is $10/share (52% downside). Any deal above $10/share would lower FISV’s ROIC.
Optimism Remains Baked Into Stock Price Without Acquisition
As we show above, significant optimism is priced into ACIW. Without acquisitions, the profit growth expectations in the current stock look unrealistically high. Specifically, to justify the current price, ACIW must maintain its TTM NOPAT margin of 7.5% and grow NOPAT by 10% compounded annually for the next 12 years to justify its current price of $21/share. For reference, ACIW’s NOPAT fell 17% year-over year in 2015 to $96 million. Over the trailing twelve months, NOPAT has fallen even further to $78 million. Also in this scenario, ACIW would be growing revenue 12% compounded annually, despite ACIW management guiding for 4-7% organic revenue growth in 2016, achieving only 3% organic revenue growth in 2015, and a -2% organic revenue decline in 2014.
Even if we assume ACIW can grow revenue at the top end of 2016 guidance indefinitely, the stock is still overvalued. If ACIW can maintain TTM NOPAT margins and grow NOPAT by 5% compounded annually for the next decade, the stock is worth only $9/share today – a 57% downside. Each of these scenarios also assumes the company is able to grow revenue and NOPAT without spending on working capital or fixed assets, an assumption that is unlikely, but allows us to create a very optimistic scenario. For reference, since 2010, ACIW’s invested capital has grown on average $282 million (27% of 2015 revenue) per year. Long-term, over the past decade, ACIW’s invested capital has grown on average by $159 million (15% of 2015 revenue) per year.
Catalyst: Backlog Falls Short, Investors Tire Of Dilution
Over the past five years, ACIW is up nearly 100%, as investors have largely ignored the destructive nature of ACIW’s acquisitions. Over this same time though, revenue has been growing at a fast pace, and GAAP net income has steadily increased. However, the tides may be turning, as ACIW has made no acquisitions in 2016, and revenue will rely on organic growth moving forward. If ACIW is unable to meet market expectations, we could see the stock fall sharply considering the high expectations embedded in the current price.
Additionally, as alluded to earlier, if ACIW’s 60-month backlog fails to increase, or fails to actually convert into tangible revenues (and profits), investors will be forced to re-evaluate ACIW’s valuation. As shown in Figure 1, the economics of the business are in decline, and if top-line growth or backlog growth can no longer mask that, we may see ACIW fall to more rational levels.
Lastly, in an effort to spur further top-line growth, ACIW may turn to another acquisition. In this case, investors may be unwilling to accept further shareholder dilution, which has failed, to this point, to create any additional shareholder value. In this case, investors could jump ship and find better investments in companies focused on creating shareholder value.
Insider Sales and Short Interest Remains Low
Over the past 12 months 222 thousand shares have been purchased and 317 thousand have been sold for a net effect of 95 thousand insider shares sold. These sales represent <1% of shares outstanding. Additionally, there are 5.9 million shares sold short, or just over 5% of shares outstanding.
Executives Are Held Accountable, Albeit To Poor Metrics
ACI Worldwide executives receive annual cash bonuses for achieving operating income and new sales bookings, net of term extension (SNET) goals. In 2015, executives failed to meet these goals and as such, no payout was made under the cash incentive program. On the surface this would appear a positive development in executive compensation.
However, it must be noted that “in order to enhance retention of MIC plan participants and incent continued shareholder value creation,” the compensation committee granted retention awards, worth 49% of the value that would have been paid if ACIW met its operating income and SNET goals.
Additionally, in order to “recognize the increase in shareholder value,” the committee awarded performance-based shares to replace the 2013 and 2014 long-term incentive program that would not meet its goals. These shares now vest based on 2015 and 2016 EBITDA targets.
Both short-term and long-term bonuses are given based on metrics that don’t directly equate to profits or shareholder value creation. The best way to create shareholder value, and align executives with the best interest of shareholders, is to tie performance bonuses to ROIC. The reason for using ROIC as the target metric is that there is a clear correlation between ROIC and shareholder value.
Impact of Footnotes Adjustments and Forensic Accounting
In order to derive the true recurring cash flows, an accurate invested capital, and a real shareholder value, we made the following adjustments to ACI Worldwide’s 2015 10-K:
Income Statement: we made $83 million of adjustments with a net effect of removing $11 million in non-operating expenses (1% of revenue). We removed $47 million related to non-operating expenses and $36 million related to non-operating income. See all adjustments made to ACIW’s income statement here.
Balance Sheet: we made $717 million of adjustments to calculate invested capital with a net increase of $97 million. The most notable adjustment was $169 million (11% of net assets) related to midyear acquisitions. See all adjustments to ACIW’s balance sheet here.
Valuation: we made $906 million of adjustments with a net effect of decreasing shareholder value by $822 million. One of the largest adjustments, was the removal of $825 million (34% of market cap) due to total debt, which includes $72 million in off-balance sheet debt.
Dangerous Funds That Hold ACIW
The following funds receive our Dangerous-or-worse rating and allocate significantly to ACI Worldwide.
- Nationwide Small Company Growth Fund (NWSAX) – 4.3% allocation and Very Dangerous rating.
- Brown Capital Management Small (BCSSX) – 4.3% allocation and Dangerous rating.
- Ivy Science & Technology Fund (ISTEX) – 3.6% allocation and Very Dangerous rating.
This article originally published here on June 20, 2016
Disclosure: David Trainer and Kyle Guske II receive no compensation to write about any specific stock, style, or theme.
Click here to download a PDF of this report.
Photo Credit: compujobs.co.za
*6/29 Update: Report updated to remove an incorrect statement regarding growth in shares outstanding


1 Response to "Danger Zone: ACI Worldwide (ACIW)"
ACIW falls 15% as Q3 earnings disappoint. Down 27% since original publish date