
We published an update on this Danger Zone pick on July 15, 2019. A copy of the associated report is here.
Check out this week’s Danger Zone interview with Chuck Jaffe of Money Life and Marketwatch.com
This week’s Danger Zone pick has seen margins contract as early success brought more competition. To try and offset competitors taking market share, the firm made numerous shareholder value-destroying acquisitions. Nevertheless, the stock is up 28% over the past year and is pricing in aggressively optimistic improvements in revenue growth and profit margins. Verint Systems (VRNT: $44/share) is in the Danger Zone this week.
Profits Are Headed In The Wrong Direction
Verint Systems’ after-tax profit (NOPAT) declined from $111 million in 2014 to $34 million in 2017, or -33% compounded annually. Revenue has grown 5% compounded annually over the same time, per Figure 1. Verint’s NOPAT margin has also fallen from 12% in 2014 to 3% in 2017.
Figure 1: Verint Systems NOPAT Decline
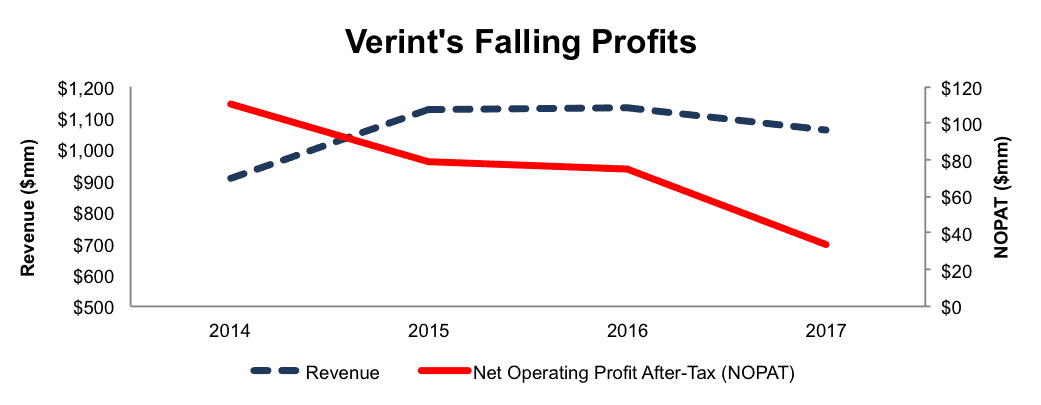
Sources: New Constructs, LLC and company filings
Verint has burned through $445 million (16% of market cap) in free cash flow over the past five years. It burned $104 million (4% of market cap) in 2017. The company’s $311 million in cash currently on the books can support the 2017 cash burn rate for less than three years. Verint’s fundamentals are trending in the wrong direction.
Acquisitions Have Been A Poor Use of Capital
Management continually touts acquisitions as “earnings accretive” or “shareholder friendly” based on the high low fallacy. More rigorous research reveals these acquisitions to be poor allocations of capital and harmful to the economics of the business.
Since 2014, Verint has spent upwards of $765 million (28% of market cap) to acquire companies including KANA Software, UTX Technologies, and Contact Solutions. While these acquisitions helped grow revenue, they did little to grow profits and earn a quality return on invested capital (ROIC). Per Figure 2, VRNT’s ROIC was 10% in 2014 and has fallen to a bottom-quintile 2%. Verint’s acquisitions have not been as accretive to equity owners as the company reported.
Figure 2: Acquisitions Lead to Declining ROIC
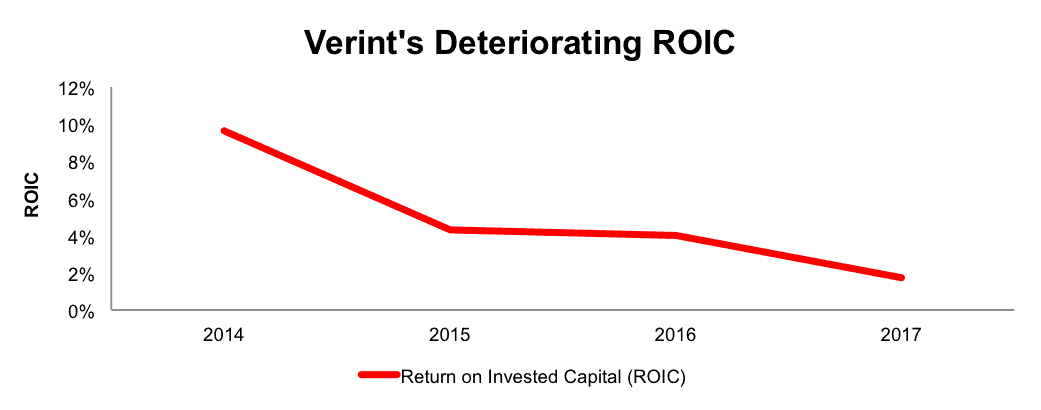
Sources: New Constructs, LLC and company filings
Executive Compensation Plan Creates Corporate Governance Risk
Verint’s executive compensation incentives are not aligned with shareholders’ interests. Misaligned compensation plans can lead to poor capital allocation decisions as outlined in Figure 2 because they reward executives for destroying shareholder value.
Verint’s executives are eligible for base salaries, cash incentives, and long-term equity awards. Bonus payouts are based on performance goals established by the compensation committee. The goals include revenue, operating income, operating cash flow, and “management business objectives.” These metrics fail to measure shareholder value creation.
Long-term equity awards are given in a mix of time based and performance based restricted stock units. Restricted stock units are granted based on an equal weighting of revenue, EBITDA, and total shareholder return goals. As shown earlier, acquisitions can grow revenue while profits deteriorate. Furthermore, investors should be wary of heavy use of stock price as an incentive. Decisions can be made to maximize stock price in the short-term while the long-term best interests of the business go ignored.
As we’ve shown in numerous case studies, ROIC, not EBITDA, revenue, or management business objectives, is the primary driver of shareholder value creation. Without major changes to this compensation plan (e.g. emphasizing ROIC), investors should expect further value destruction.
Non-GAAP Metrics Attempt to Hide Losses
Verint uses non-GAAP metrics such as non-GAAP revenue, non-GAAP operating income, adjusted EBITDA, and non-GAAP net income to paint the business in a more positive light. Below are some of the items Verint has removed when calculating its non-GAAP metrics:
- Stock based compensation expense
- Acquisition expenses
- Restructuring expenses
- Amortization of acquired technology
- Impairment charges
These adjustments have a large impact on the disparity between GAAP net income, non-GAAP net income, and economic earnings. In 2016 and 2017, Verint removed nearly $65 million (6% of revenue) and $66 million (6% of revenue), respectively, in expenses related to stock-based compensation to calculate non-GAAP net income. Additionally, the firm removed $29 million (3% of revenue) in restructuring and acquisition expenses in 2017. When added with the other adjustments, Verint reported 2017 non-GAAP net income of $159 million. Per Figure 3, GAAP net income was -$29 million and economic earnings were -$87 million in 2017.
Figure 3: Disconnect Between Non-GAAP & Economic Earnings
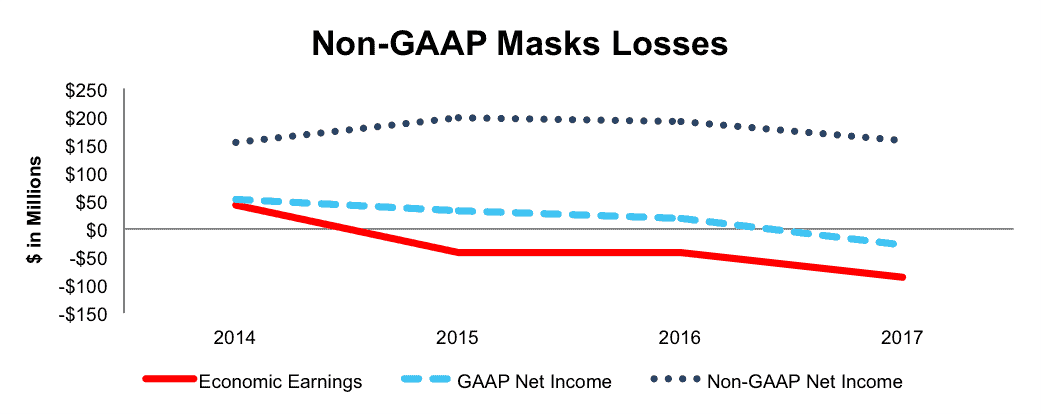
Sources: New Constructs, LLC and company filings
Lagging Profitability Across Multiple Markets
Verint’s business straddles two separate markets, each ripe with competition. Its Customer Engagement segment (66% of 2017 revenue) provides customer experience/behavior analysis, workforce optimization, and employee engagement services. Its Cyber Intelligence segment (34% of 2017 revenue) provides data mining, threat protection systems, and more. These broad ranging services pit Verint’s business against the likes of Oracle (ORCL), Microsoft (MSFT), International Business Machines (IBM, Elbit Systems (ESLT), Pegasystems (PEGA), and salesforce.com (CRM), among others.
Per Figure 4, Verint Systems’ ROIC and NOPAT margin fall well below its competition. In fact, the only firms with lower margins are prior Danger Zone picks salesforce.com and FireEye (FEYE), the latter of which is down 12% while the S&P is up 18% since the original Danger Zone report. Success in the intelligence analytics industries is ultimately dependent upon the functionality of the product offered and price. The firms with the highest profitability, such as Oracle or even Nice Systems, have greater flexibility to invest in product enhancements or undercut competitors’ pricing if necessary. Firms with lower profitability, such as Verint, face margin pressures and have less ability to invest in product innovation.
Figure 4: Verint Systems’ Lagging Profitability
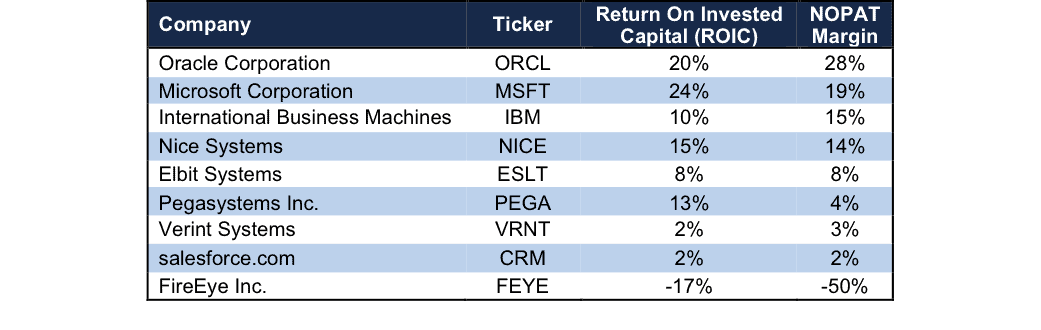
Sources: New Constructs, LLC and company filings
Bulls Case Ignores Verint’s Struggles Since Entering Customer Engagement
Verint bulls will point to the growing intelligence/data analytics market, increased cyber threats, and changing customer engagement preferences as reasons to buy into the firm’s potential. However, the bulls’ beliefs ignore the issues Verint has faced since its acquisition of KANA Software and the firm’s inability to improve margins as it has scaled.
Verint aimed to create an end-to-end product suite for workforce optimization, enterprise processes, and customer interaction with its acquisition of KANA Software. This acquisition greatly improved its addressable market, but also significantly increased competition. At the same time, it did not provide Verint a competitive advantage, as the firm has been forced to continually increase spending to remain competitive. Per Figure 5, Verint’s cost of revenues, research & development, and sales, general, and administrative costs have grown 11%, 11%, and 8% compounded annually respectively since 2014. Over the same time, revenue has grown just 5% compounded annually.
Figure 5: Verint’s Expenses Growing Quicker Than Revenue

Sources: New Constructs, LLC and company filings
These growing costs, particularly R&D, are critical to Verint’s success. The firm recognizes it must consistently develop new products that address changes in technology and customer needs. Additionally, the company expects to increase hiring to meet project demands, which will only further increase operating expenses. Worse yet, beginning in 2016, the firm began experiencing extended sales cycles, reduction in deal sizes, and pressure in portions of its legacy business. Verint’s business model, mixing on-premise and hybrid cloud solutions is getting less profitable as it grows.
More troubling, the profit decline since 2014 cannot be attributed to Verint not “reaching scale”, as many start-up firms will argue. The company already serves over 10,000 customers including 80% of the Fortune 100. With such a large customer base, and some of the most successful firms across the globe, it begs the question of whether Verint’s business model can ever meet the expectations bulls have.
Lastly, the market’s expectations baked into Verint Systems’ stock price imply that the firm will reverse years of margin declines, significantly grow profits, and take large market share, as we’ll show below.
Verint Is Already Priced For Perfection
At its current price, VRNT is significantly overvalued. To justify its current price of $44/share, VRNT must achieve NOPAT margins of 6% (compared to 3% in 2017) and grow NOPAT by 19% compounded annually for the next 12 years. In this scenario, Verint would be generating $4.1 billion in revenue 12 years from now, which is greater than Elbit Systems’ 2016 revenue or FireEye, Pegasystems, and Nice Systems last fiscal year revenue combined. This scenario also seems unlikely given that VRNT’s NOPAT has fallen 33% compounded annually since 2014.
Even if we assume Verint can achieve a 6% NOPAT margin and grow NOPAT by 14% compounded annually for the next decade, the stock is worth only $20/share today – a 55% downside. Each of these scenarios also assumes Verint Systems is able to grow revenue and NOPAT/free cash flow without spending on working capital or fixed assets. This assumption is unlikely but allows us to create very optimistic scenarios that demonstrate how high expectations in the current valuation are. For reference, VRNT’s invested capital has grown on average $167 million (16% of 2017 revenue) per year over the last five years.
Is VRNT Worth Acquiring?
The largest risk to our bear thesis is what we call “stupid money risk”, which means an acquirer comes in and pays for VRNT at the current, or higher, share price despite the stock being overvalued. With large competitors already providing competing services, we see an acquisition as possible only if an acquiring firm is willing to ignore prudent stewardship of capital and destroy substantial shareholder value. We show below how expensive VRNT remains even after assuming an acquirer can achieve significant synergies.
To begin, Verint Systems has liabilities of which investors may not be aware that make it more expensive than the accounting numbers suggest.
- $125 million in off-balance-sheet operating leases (5% of market cap)
- $8 million in minority interests (<1% of market cap)
- $4 million in deferred tax liabilities (<1% of market cap)
After adjusting for these liabilities we can model multiple purchase price scenarios. Even in the most optimistic of scenarios, VRNT is not worth the current share price.
Figures 6 and 7 show what we think Microsoft (MSFT) should pay for Verint to ensure it does not destroy shareholder value. Microsoft could immediately integrate Verint’s customer engagement software into its enterprise offerings to increase platform value within the market. However, there are limits on how much MSFT would pay for VRNT to earn a proper return, given the NOPAT or free cash flows being acquired.
Each implied price is based on a ‘goal ROIC’ assuming different levels of revenue growth. In each scenario, the estimated revenue growth rate in year one and two equals 7%, which is the consensus estimate of revenue growth in the next two years. For the subsequent years, we use 7% in scenario one because it represents a continuation of next year’s expectations. We use 12% in scenario two because it assumes a merger with MSFT could create revenue growth through increased platform exposure and client usage.
We conservatively assume that Microsoft can grow Verint’s revenue and NOPAT without spending on working capital or fixed assets. We also assume Verint immediately achieves an 11% NOPAT margin, which is the average of Microsoft’s and Verint’s current NOPAT margin. For reference, VRNT’s current NOPAT margin is 3%, so this assumption implies immediate improvement and allows the creation of a truly best case scenario.
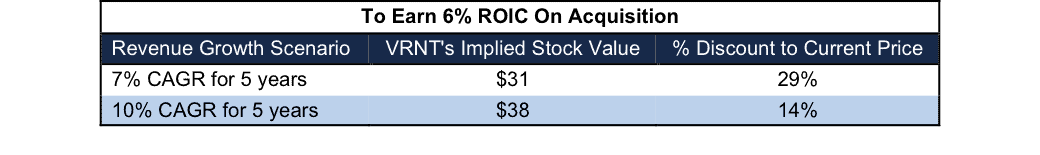
Figure 6: Implied Acquisition Prices For MSFT To Achieve 6% ROIC
Sources: New Constructs, LLC and company filings.
Figure 6 shows the ‘goal ROIC’ for MSFT as its weighted average cost of capital (WACC) or 6%. Even if Verint can grow revenue by 7% compounded annually with an 11% NOPAT margin for the next five years, the firm is worth less than its current price of $44/share. It’s worth noting that any deal that only achieves a 6% ROIC would be only value neutral and not accretive, as the return on the deal would equal MSFT’s WACC.
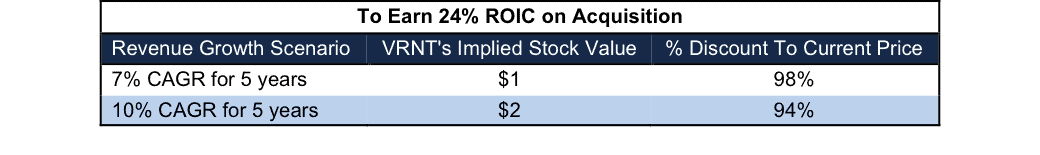
Figure 7: Implied Acquisition Prices For MSFT To Achieve 24% ROIC
Sources: New Constructs, LLC and company filings.
Figure 7 shows the next ‘goal ROIC’ of 24%, which is Microsoft’s current ROIC. Acquisitions completed at these prices would be truly accretive to MSFT shareholders. Even in the best-case growth scenario, the most MSFT should pay for VRNT is $2/share (94% downside). Even assuming this best-case scenario, MSFT would destroy over $3 billion by purchasing VRNT at its current valuation. Any scenario assuming less than 10% CAGR in revenue would result in further capital destruction for MSFT.
Strong Competitive Landscape Makes Expensive Valuation Even Riskier
Investors seem to be willing to overlook competitive concerns or low profitability for an extended period of time when a firm is rapidly growing revenue. If the revenue growth slows or stops, the stock’s valuation could crater. Over the past year, VRNT’s stock price has not reflected the deteriorating fundamentals of its business. Revenue fell 6% year over year in fiscal 2017 and the company expects only mid single digit revenue growth in the coming year. Has VRNT’s 28% increase in share price over the past year only set VRNT up for a larger fall?
Verint’s future growth potential is directly aligned with its ability to cut costs while still attracting new business. However, as noted earlier, the firm plans on hiring more personnel and must continually enhance its software solutions to remain attractive in a crowded marketplace. Since entering the customer engagement market, Verint has shown no signs of improving profitability. With the company’s strongest quarter of the year (Q4) now in the rear view, the deteriorating fundamentals should come back into focus. When the focus does shift, we believe Verint is only one revenue miss away from seeing a significant cut to its valuation.
VRNT’s valuation implies it will grow revenues at over 12% (well above consensus expectations of 7%) while also reversing falling margins in a highly competitive market. While we don’t’ attempt to predict exactly when the market will recognize the disconnect between expectations and reality, we know the highly negative impact failing to meet revenue expectations can have on the stock price.
When Verint reported fiscal 3Q15 revenue below expectations, the stock fell 9% the next day. In fiscal 3Q16, when Verint failed to meet revenue expectations again, the stock fell 10% the next day. Without consistent revenue growth, investors risk VRNT falling, steeply, to more rational levels.
Insider Action and Short Interest Are Minimal
Over the past 12 months, 312 thousand insider shares have been purchased and 139 thousand have been sold for a net effect of 173 thousand insider shares purchased. These purchases represent less than 1% of shares outstanding. Additionally, there are 1.7 million shares sold short, or 3% of shares outstanding.
Impact of Footnotes Adjustments and Forensic Accounting
Our robo-analyst technology enables us to perform forensic accounting with scale and provide the research needed to fulfill fiduciary duties. In order to derive the true recurring cash flows, an accurate invested capital, and a real shareholder value, we made the following adjustments to Verint Systems’ 2017 10-K:
Income Statement: we made $65 million of adjustments with a net effect of removing $63 million in non-operating expense (6% of revenue). We removed $64 million related to non-operating expenses and $1 million related to non-operating income. See all the adjustments made to VRNT’s income statement here.
Balance Sheet: we made $732 million of adjustments to calculate invested capital with a net increase of $37 million. One of the most notable adjustments was $157 million (8% of reported net assets) related to other comprehensive income. See all adjustments to VRNT’s balance sheet here.
Valuation: we made $1.1 billion of adjustments with a net effect of decreasing shareholder value by $629 million. The most notable adjustment to shareholder value was $874 million in total debt, which includes $125 million in off-balance sheet operating leases. This lease adjustment represents 5% of VRNT’s market cap.
Dangerous Funds That Hold VRNT
There following funds receive our Dangerous-or-worse rating and allocate significantly to Verint Systems.
- Bernzott US Small Cap Value Fund (BSCVX) – 3.4% allocation and Dangerous rating.
- Neuberger Berman Intrinsic Value Fund (NINAX) – 2.6% allocation and Very Dangerous rating.
- Victory RS Partners Fund (RSPFX) – 2.6% allocation and Very Dangerous rating.
- Meridian Contrarian Fund (MFCCX) – 2.5% allocation and Dangerous rating.
This article originally published on April 3, 2017.
Disclosure: David Trainer and Kyle Guske II receive no compensation to write about any specific stock, style, or theme.
Follow us on Twitter, Facebook, LinkedIn, and StockTwits for real-time alerts on all our research.
Scottrade clients get a Free Gold Membership ($588/yr value) as well as 50% discounts and up to 20 free trades ($140 value) for signing up to Platinum, Pro or Unlimited memberships. Login or open your Scottrade account & find us under Quotes & Research/Investor Tools.