
Three new stocks make May’s Exec Comp Aligned with ROIC Model Portfolio, available to members as of May 15, 2020.
Recap from April’s Picks
Our Exec Comp Aligned with ROIC Model Portfolio (+3.3%) outperformed the S&P 500 (+1.4%) by 1.9% from April 15, 2020 through May 13, 2020. The best performing stock in the portfolio was up 16%. Overall, eight out of the 15 Exec Comp Aligned with ROIC Stocks outperformed the S&P from April 15, 2020 through May 13, 2020.
Only our research utilizes the superior data and earnings adjustments featured by the HBS & MIT Sloan paper,"Core Earnings: New Data and Evidence.” The success of this Model Portfolio highlights the value of our Robo-Analyst technology[1], which scales our forensic accounting expertise (featured in Barron’s) across thousands of stocks.
This Model Portfolio only includes stocks that earn an Attractive or Very Attractive rating and align executive compensation with improving ROIC. We think this combination provides a uniquely well-screened list of long ideas because return on invested capital (ROIC) is the primary driver of shareholder value creation.[2]
New Stock Feature for May: Oshkosh Corporation (OSK: $66/share)
Oshkosh Corporation (OSK) is the featured stock in May’s Exec Comp Aligned with ROIC Model Portfolio.
We made OSK a Long Idea in August 2019. Since then, the stock has underperformed the S&P 500 (down 12% vs S&P up 3%) and the stock is even more undervalued today.
Oshkosh has grown revenue by 10% compounded annually and after-tax profit (NOPAT) by 32% compounded annually since 2016. Longer term, Oshkosh has grown NOPAT by 17% compounded annually over the past decade. Oshkosh’s NOPAT margin increased from 4% in 2016 to 7% over the trailing-twelve-months (TTM), while its invested capital turns improved from 1.36 to 1.53 over the same time. Improvements in both NOPAT margin and invested capital turns drive Oshkosh’s ROIC from 6% in 2016 to 10% TTM.
Figure 1: Oshkosh’s Revenue & NOPAT Since 2016
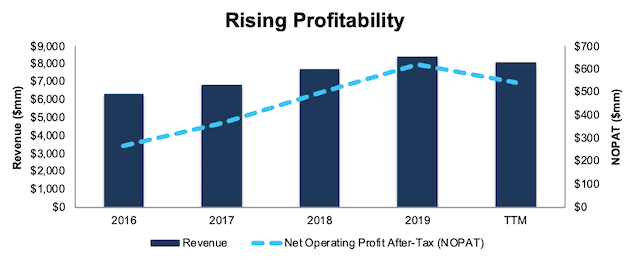
Sources: New Constructs, LLC and company filings
Compensation Plan Properly Incentivizes Executives
Oshkosh has included ROIC as part of its executive compensation plan since 2000. Performance shares account for 40% of the total value of Oshkosh’s long-term incentives for its executives. Oshkosh links half of its performance share awards to the firm’s relative ROIC performance.
In addition to performance shares, 25% to 30% of executives’ annual cash incentive awards are tied to days net working capital (DNWC) – a measure of capital efficiency. Changes in NWC directly impact a firm’s invested capital, which is the denominator in our calculation of ROIC. This focus on capital efficiency helped the firm increase its invested capital turns from 1.57 in 2018 to 1.65 in 2019.
Oshkosh’s emphasis on ROIC helps ensure intelligent capital allocation to create shareholder value. While the TTM period is down from 2019, Oshkosh increased ROIC year-over-year (YoY) in each of the past three years. Per Figure 2, ROIC improved from 7% in 2014 to 11% in 2019.
Figure 2: Oshkosh’s ROIC Since 2016
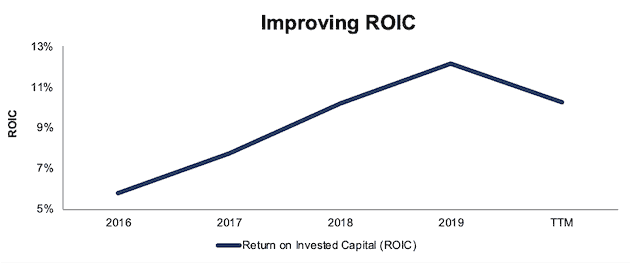
Sources: New Constructs, LLC and company filings
OSK is Undervalued
At its current price of $66/share, OSK has a price-to-economic book value (PEBV) ratio of 0.6. This ratio means the market expects Oshkosh’s NOPAT to permanently decline by 40%. This expectation seems overly pessimistic for a firm that has grown NOPAT by 10% compounded annually over the past five years and 17% compounded annually over the past decade.
While Oshkosh has faced several challenges resulting from the COVID-19 pandemic, including slowing customer demand, supply disruptions, and plant shutdowns, we believe that the firm will begin to grow NOPAT again in 2021. This expectation is in line with the International Monetary Fund (IMF) and nearly every economist in the world who believe the global economy will grow strongly in 2021. The overall growth in the economy should lead to increased customer demand and profitability for this manufacturer.
Even if Oshkosh’s NOPAT margin falls to 6% (10-year average) and the firm grows revenue by just 2% compounded annually for the next decade, the stock is worth $115/share today – a 74% upside. See the math behind this reverse DCF scenario.
Critical Details Found in Financial Filings by Our Robo-Analyst Technology
As investors focus more on fundamental research, research automation technology is needed to analyze all the critical financial details in financial filings as shown in the Harvard Business School and MIT Sloan paper, "Core Earnings: New Data and Evidence”.
Below are specifics on the adjustments we make based on Robo-Analyst findings in Oshkosh’s 2019 10-K:
Income Statement: we made $96 million of adjustments, with a net effect of removing $38 million in non-operating expenses (<1% of revenue). You can see all the adjustments made to Oshkosh’s income statement here.
Balance Sheet: we made $1.9 billion of adjustments to calculate invested capital with a net increase of $1.3 billion. One of the largest adjustments was $1.2 billion in asset write-downs. This adjustment represented 31% of reported net assets. You can see all the adjustments made to Oshkosh’s balance sheet here.
Valuation: we made $1.2 billion of adjustments with a net effect of decreasing shareholder value by $1.1 billion. Apart from total debt, one of the largest adjustments to shareholder value was $189 million in underfunded pensions. This adjustment represents 4% of Oshkosh’s market cap. See all adjustments to Oshkosh’s valuation here. Despite these subtractions from shareholder value, Oshkosh remains undervalued.
This article originally published on May 22, 2020.
Disclosure: David Trainer, Kyle Guske II, and Matt Shuler receive no compensation to write about any specific stock, style, or theme.
Follow us on Twitter, Facebook, LinkedIn, and StockTwits for real-time alerts on all our research.
[1] Harvard Business School features the powerful impact of our research automation technology in the case New Constructs: Disrupting Fundamental Analysis with Robo-Analysts.
[2] This paper compares our analytics on a meg cap company to Bloomberg and Capital IQ (SPGI) in a detailed appendix.