
Recap from September’s Picks
Our Most Attractive Stocks (-0.6%) outperformed the S&P 500 (-1.3%) from September 3, 2020 through October 5, 2020 by 0.7%. The best performing large cap stock gained 20% and the best performing small cap stock was up 19%. Overall, 15 out of the 40 Most Attractive stocks outperformed the S&P 500.
Our Most Dangerous Stocks (+2.6%) underperformed the S&P 500 (-1.3%) as a short portfolio from September 3, 2020 through October 5, 2020 by 3.9%. The best performing large cap stock fell by 7% and the best performing small cap stock fell by 22%. Overall, 13 out of the 35 Most Dangerous stocks outperformed the S&P 500 as shorts.
The Most Attractive/Most Dangerous Model Portfolios underperformed as an equal-weighted long/short portfolio by 1.6%.
Only our research utilizes the superior data and earnings adjustments featured by the HBS & MIT Sloan paper,"Core Earnings: New Data and Evidence.” The successes of these model portfolios highlight the value of our machine learning and AI Robo-Analyst technology[1], which helps clients fulfill the fiduciary duty of care and make smarter investments[2].
Eight new stocks make our Most Attractive list this month, and three new stocks fall onto the Most Dangerous list this month. October’s Most Attractive and Most Dangerous stocks were made available to members on October 7, 2020.
Our Most Attractive stocks have high and rising returns on invested capital (ROIC) and low price to economic book value ratios. Most Dangerous stocks have misleading earnings and long growth appreciation periods implied by their market valuations.
Most Attractive Stocks Feature for October: BJ's Wholesale Club Holdings, Inc. (BJ: $40/share)
BJ's Wholesale Club Holdings, Inc. (BJ), is the featured stock from October’s Most Attractive Stocks Model Portfolio.
BJ's Wholesale Club has grown revenue by 2% compounded annually and after-tax profit (NOPAT) by 20% compounded annually over the past three years.
BJ's Wholesale Club’s NOPAT margin increased from 1.8% in fiscal-year-ended (FYE) 2017 to 3.3% over the trailing-twelve-months (TTM) while its invested capital turns improved from 2.6 to 3.3 over the same time. The combination of rising margins and invested capital turns drive BJ's Wholesale Club’s ROIC from 5% in FYE 2017 to 11% TTM.
Figure 1: Revenue & NOPAT Since FYE 2017
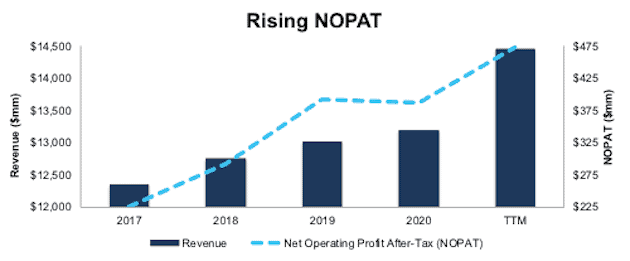
Sources: New Constructs, LLC and company filings
BJ Is Undervalued
At its current price of $40/share, BJ has a price-to-economic book value (PEBV) ratio of 0.7. This ratio means the market expects BJ’s Wholesale Club’s NOPAT to permanently decline by 30%. This expectation seems overly pessimistic for a firm that grew NOPAT by 20% compounded annually since FYE 2017.
Even if BJ’s Wholesale Club’s NOPAT margin falls to 2.9% (equal to FYE 2020 margin vs. 3.3% TTM) and the firm grows NOPAT by just 2% compounded annually for the next decade, the stock is worth $57/share today – a 43% upside. See the math behind this reverse DCF scenario.
Critical Details Found in Financial Filings by Our Robo-Analyst Technology
As investors focus more on fundamental research, research automation technology is needed to analyze all the critical financial details in financial filings as shown in the Harvard Business School and MIT Sloan paper, "Core Earnings: New Data and Evidence”.
Below are specifics on the adjustments we make based on Robo-Analyst findings in BJ’s Wholesale Club’s FYE 2020 10-K:
Income Statement: we made $325 million of adjustments, with a net effect of removing $199 million in non-operating expenses (1% of revenue). You can see all the adjustments made to BJ’s Wholesale Club’s income statement here.
Balance Sheet: we made $998 million of adjustments to calculate invested capital with a net increase of $894 million. One of the largest adjustments was $522 million in operating leases. This adjustment represented 15% of reported net assets. You can see all the adjustments made to BJ’s Wholesale Club’s balance sheet here.
Valuation: we made $4.1 billion of adjustments with a net effect of decreasing shareholder value by $4.1 billion. There were no adjustments that increased shareholder value. Apart from total debt, which includes the operating leases noted above, the most notable adjustment to shareholder value was $108 million in outstanding employee stock options. This adjustment represents 2% of BJ’s Wholesale Club’s market cap. See all adjustments to BJ’s Wholesale Club’s valuation here.
Most Dangerous Stocks Feature: Ceridian HCM Holding Inc (CDAY: $90/share)
Ceridian HCM Holding Inc (CDAY) is the featured stock from October’s Most Dangerous Stocks Model Portfolio.
While Ceridian’s GAAP net income improved from -$30 million in 2017 to $75 TTM, the firm’s economic earnings, the true cash flows of the business, only slightly improved from -$152 million to -$140 million over the same time. Ceridian’s NOPAT margin fell from 9% in 2019 to 8% TTM while the firm’s ROIC fell from 2.6% to 2.3% over the same time.
Figure 2: GAAP Net Income vs. Economic Earnings
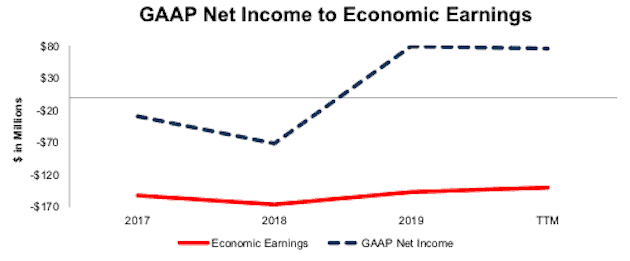
Sources: New Constructs, LLC and company filings
CDAY Provides Poor Risk/Reward
Despite its deteriorating fundamentals, CDAY is still priced for significant profit growth and is overvalued.
To justify its current price of $90/share, Ceridian must achieve an 18% NOPAT margin (twice its all-time high of 9%) and grow NOPAT by 32% compounded annually over the next decade. See the math behind this reverse DCF scenario. This expectation seems overly optimistic given that Ceridian’s NOPAT has grown much slower, at just 20% compounded annually, since 2017.
Even if Ceridian can achieve margins of 12% (vs. 8% TTM) and continue growing NOPAT by 20% compounded annually for the next 10 years, the stock is worth just $27/share today, a 70% downside to the current stock price. See the math behind this reverse DCF scenario.
Each of these scenarios also assumes Ceridian is able to grow revenue, NOPAT, and FCF without increasing working capital or fixed assets. This assumption is unlikely, but allows us to create best-case scenarios that demonstrate how high expectations embedded in the current valuation are. For reference, Ceridian’s invested capital has increased by 13% since 2017.
Critical Details Found in Financial Filings by Our Robo-Analyst Technology
As investors focus more on fundamental research, research automation technology is needed to analyze all the critical financial details in financial filings as shown in the Harvard Business School and MIT Sloan paper,"Core Earnings: New Data and Evidence”.
Below are specifics on the adjustments we make based on Robo-Analyst findings in Ceridian’s 2019 10-K:
Income Statement: we made $132 million of adjustments, with a net effect of removing $6 million in in non-operating income (1% of revenue). You can see all the adjustments made to Ceridian’s income statement here.
Balance Sheet: we made $737 million of adjustments to calculate invested capital with a net increase of $6 million. One of the largest adjustments was $359 million in other comprehensive income. This adjustment represented 13% of reported net assets. You can see all the adjustments made to Ceridian’s balance sheet here.
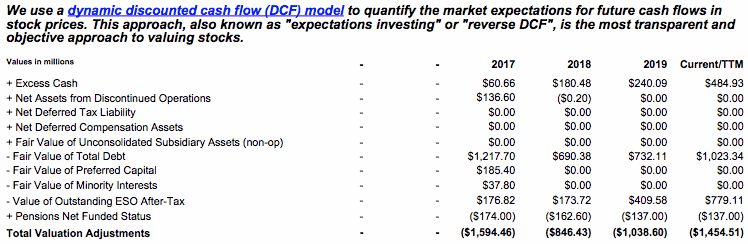
Valuation: we made $2.4 billion of adjustments with a net effect of decreasing shareholder value by $1.5 billion. Apart from total debt, the most notable adjustment to shareholder value was $779 million in employee stock options. This adjustment represents 6% of Ceridian’s market cap. See all adjustments to Ceridian’s valuation here.
This article originally published on October 16, 2020.
Disclosure: David Trainer, Kyle Guske II, and Matt Shuler receive no compensation to write about any specific stock, style, or theme.
Follow us on Twitter, Facebook, LinkedIn, and StockTwits for real-time alerts on all our research.
[1] Harvard Business School features the powerful impact of our research automation technology in the case New Constructs: Disrupting Fundamental Analysis with Robo-Analysts.
[2] Compare our analytics on a mega cap company to Bloomberg and Capital IQ’s (SPGI) analytics in the detailed appendix of this paper.