We closed JBSS on May 17, 2023. A copy of the associated Position Close report is here.
Check out this week’s Danger Zone interview with Chuck Jaffe of Money Life.
Despite seeing increased demand as the COVID-19 pandemic caused many consumers to load up on home goods, this vertically integrated consumer packaged foods firm trades as if profits will permanently decline moving forward. Investors overlooking John B. Sanfilippo & Son (JBSS: $82/share) are in the Danger Zone. Despite rebounding from its March lows, there’s still value in this Long Idea.
Baby Thrown Out with the Bathwater
We first made John B. Sanfilippo & Son a Long Idea in November 2017 and closed the position in November 2018. However, closing this position was premature as the stock has outperformed since our original article (+37% vs. S&P +21%) the firm’s profits have improved ever since. Despite rising from its March lows, JBSS still trades well below its pre-COVID market crash peak and is significantly undervalued.
John B. Sanfilippo & Son’s History of Profit Growth
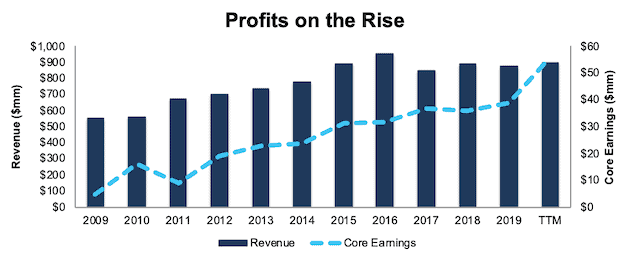
John B. Sanfilippo & Son has a strong history of profit growth. Over the past decade, John B. Sanfilippo & Son has grown revenue by 5% compounded annually and core earnings[1] by 23% compounded annually, per Figure 1. Core earnings provide a better measure of profitability and truer insights into valuation than similar measures of profits from legacy data providers.
Longer term, John B. Sanfilippo & Son has grown core earnings by 18% compounded annually over the past two decades. The firm increased its core earnings margin year-over-year (YoY) in two of the past three years and from 1% in 2009 to 6% in the trailing-twelve-month period (TTM).
Figure 1: Core Earnings & Revenue Growth Over the Past Decade
Sources: New Constructs, LLC and company filings.
John B. Sanfilippo & Son’s rising profitability helps the business generate positive free cash flow (FCF) in eight of the past ten years and a cumulative $200 million (21% of market cap) over the past five years. John B. Sanfilippo & Son’s $60 million in FCF over the TTM period equates to a 6% FCF yield, which is higher than the Consumer Non-cyclicals sector average of 5%.
Executive Compensation Plan Incentivizes Prudent Capital Stewardship
No matter the macro environment, investors should look for companies with executive compensation plans that directly align executives’ interests with shareholders’ interests. Quality corporate governance holds executives accountable to shareholders by incentivizing them to allocate capital prudently.
John B. Sanfilippo & Son’s annual incentive compensation is paid as a cash bonus and represents anywhere from 28-44% of compensation depending upon the executive. This cash bonus is based on the Sanfilippo Value-Added Plan (SVA Plan). The SVA Plan rewards executives for YoY improvement in economic profit (what we call economic earnings). The firm defines economic profit as net operating profit after tax minus a capital charge, which is determined by multiplying the weighted average cost of capital (WACC) of 9% by the invested capital in the business.
The Compensation Committee believes using YoY SVA improvement “motivates the plan participants to improve our company’s financial performance and more effectively manage its working and fixed capital by encouraging the productive use of capital resources relative to their cost.”
The focus on economic profit and prudent stewardship of capital aligns the interests of executives and shareholders and ensures executives are held accountable for creating shareholder value. John B. Sanfilippo & Son has improved its return on invested capital (ROIC) from 10% in 2015 to 18% TTM while increasing its economic earnings from $21 million to $45 million over the same time.
Balance Sheet Provides Liquidity to Survive the Crisis
Companies with strong liquidity are better positioned to survive macro-economic uncertainty. John B. Sanfilippo & Son has the liquidity to survive the current economic downturn. At the end of fiscal 3Q20 (period ending March 26, 2020) John B. Sanfilippo & Son had $76 million in available liquidity under its revolving credit facility.
In a worst-case scenario, where John B. Sanfilippo & Son generates no revenue, the firm could operate for over nine months with its available liquidity before needing additional capital. This scenario assumes Jon B. Sanfilippo & Son maintains selling and administrative expenses ($23 million in fiscal 3Q20), interest expense and rental and miscellaneous expenses at current levels.
However, it’s highly unlikely that John B. Sanfilippo & Son’s revenue would go to zero given its products are still being sold through grocery and retail locations across the country. While macro-economic uncertainty has more severely impacted other industries, food products are one of a handful of essential items that we cannot go without.
Profitability Is Tops Amongst Peers
As we noted in our original Long Idea, John B. Sanfilippo & Son has been putting more emphasis on its consumer facing business since ~2007. The shift from a more commercial ingredient provider to a consumer goods provider gives the firm more control over pricing and opportunity for increased sales and margins.
Before the current crisis, John B. Sanfilippo & Son’s profitability was trending higher and at a faster pace than its competitors. This improved profitability is a testament to the firm’s investment in infrastructure (factory automation, machine upgrades) and increased distribution across the country. With improving profitability and a strong balance sheet, John B. Sanfilippo & Son can not only survive the downturn, but is well-positioned to take market share from weaker food product firms as the economy recovers.
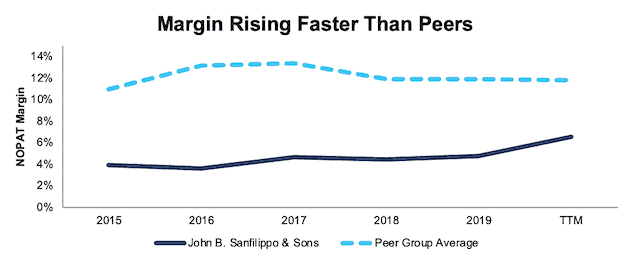
Per Figure 2, John B. Sanfilippo & Son’s net operating profit after-tax (NOPAT) margin has improved from 4% in 2015 to 7% TTM. Over the same time, the market-cap-weighted average of 22 other Packaged Foods firms only improved from 11% to 12%. This peer group includes the Kraft Heinz Co. (KHC), J&J Snack Foods (JJSF), Kellogg Company (K), General Mills (GIS), and more.
Figure 2: NOPAT Margin Vs. Peers
Sources: New Constructs, LLC and company filings.
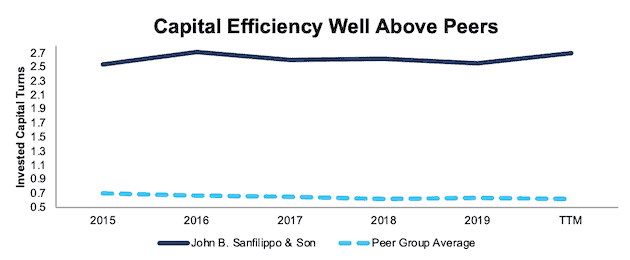
With executives incentivized to focus on the use of capital and its accompanying costs, we could expect John B. Sanfilippo & Son to excel in its overall capital efficiency. John B. Sanfilippo & Son’s invested capital turns, a measure of balance sheet efficiency, have increased from 2.5 in 2015 to 2.7 TTM. The peer group’s market-cap-weighted average invested capital turns have fallen slightly from 0.7 to 0.6 over the same time.
Figure 3: Invested Capital Turns Vs. Peers
Sources: New Constructs, LLC and company filings.
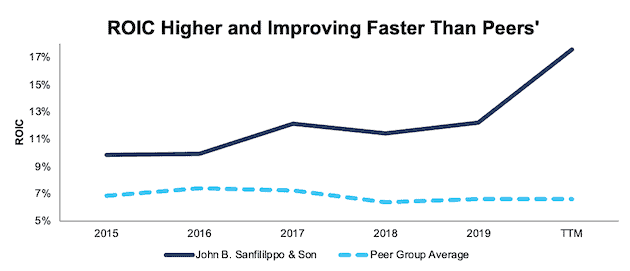
The combination of rising margins and invested capital turns drives John B. Sanfilippo & Son’s return on invested capital (ROIC) higher. Per Figure 4, John B. Sanfilippo & Son’s ROIC has improved from 10% in 2015 to 18% TTM while the market-cap-weighted average ROIC of peers has largely remained stagnant ~7% over the same time.
Figure 4: ROIC vs. Peers
Sources: New Constructs, LLC and company filings.
Food Is a Necessity, Pandemic or Not
While the COVID-19 pandemic has caused some industries, such as leisure spending, to see demand evaporate in the short term, John B. Sanfilippo & Son is in a unique position to benefit from increased demand.
In March 2020, John B. Sanfilippo & Son’s sales volume increased by 24% YoY, one-third of which the firm estimated was attributable to consumers stocking up on baking, snacking, and other foods (i.e. pantry loading). Total sales volume in the consumer channel was up 19% YoY in fiscal 3Q20 (period ending March 26, 2020).
However, the firm’s ability to grow sales during the global pandemic has insulated it from the market crash.
Growing Presence Across the Nut Market
As part of its efforts to grow its consumer business, John B. Sanfilippo & Son has introduced new brands and products, such as Orchard Valley Harvest, Fisher Oven Roasted Never Fried nuts, Squirrel Brand, and Southern Style nuts, while also expanding its distribution.
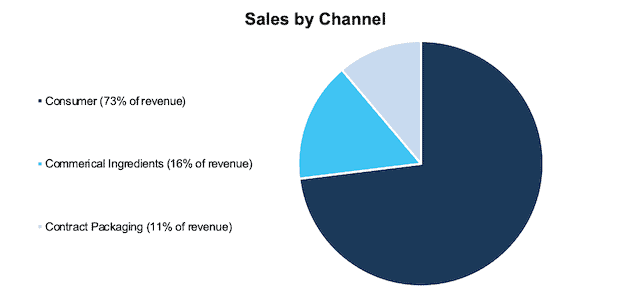
The success of this strategy can be seen in the firm’s shifting revenue makeup. Per Figure 5, 73% of John B. Sanfilippo & Son’s revenue comes from its Consumer segment, with 16% and 11% coming from the Commercial Ingredients and Contract Packaging segments respectively. In 2007, the Consumer segment made up just 51% of revenue and the Commercial Ingredients segment made up 32% of revenue.
Figure 5: John B. Sanfilippo & Son Revenue by Sales Channel – TTM
Sources: New Constructs, LLC and company filings.
More importantly, John. B. Sanfilippo & Son has been growing these brands’ market share within the larger U.S Food market.
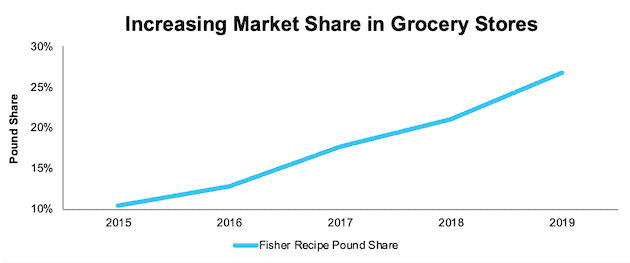
Per Figure 6, Fischer Recipe nuts’ pound share, or the share of total pounds sold, in traditional grocery stores has increased from 11% in 2015 to 27% in 2019, based on data from Information Resources Inc. (IRi), a retail packaged goods, and healthcare market research and data analytics firm. In fiscal 3Q20, John B. Sanfilippo & Son noted that sales volume for Fischer Recipe nuts declined YoY as a result of lost distribution at a large customer. Despite this loss, Fisher Recipe continues to be the brand share leader in the recipe nuts category.
Figure 6: Fisher Recipe Pound Share in the Total U.S. Food Market
Sources: New Constructs, LLC and IRi via JBSS Presentation.
Smaller brands, such as Fisher Oven Roasted Never Fried nuts are also experiencing market share growth. The Fisher Oven Roasted Never Fried pound share in markets its distributed has increased from 2.9% in 2017 to 3.3% in 2019. Orchard Valley Harvest pound share of the produce nut category has increased from 0.6% in 2016 to 1.5% in 2019.
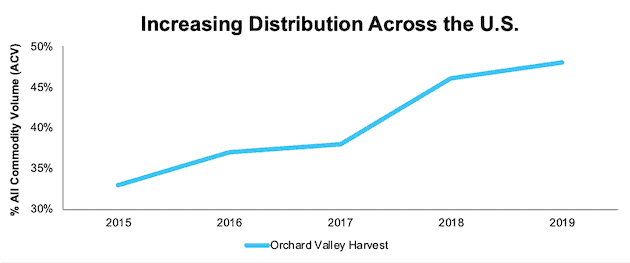
Furthermore, John B. Sanfilippo & Son has greatly increased Orchard Valley Harvest’s distribution. Per Figure 7, Orchard Valley Harvest’s all commodity volume (ACV) percentage in the U.S. has risen from 33% in 2015 to 48% in 2019. ACV % measures the percent of stores selling a particular product (in this case, Orchard Valley Harvest) weighted by stores’ size. In other words, Orchard Valley has greatly increased its presence in U.S. stores, but still has significant growth potential.
Figure 7: Orchard Valley Harvest % All Commodity Volume (ACV) in the U.S.
Sources: New Constructs, LLC and IRi via JBSS Presentation.
John B. Sanfilippo & Son Benefits from Rising Snack Trends
On a macro-level, John B. Sanfilippo & Son is well-positioned to benefit from the growing interest in snack foods, as well as the increased consumption of nuts. As Brendan Honan, vice president global brand marketing for John B. Sanfilippo & Son puts it, “the perceived health benefits of snack nuts and the drive for more plant-based protein vs. animal protein has continued to positively impact the snack nut category.”
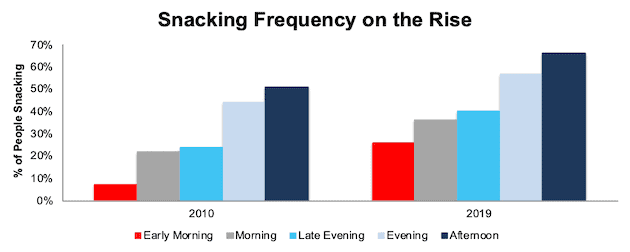
Based on data from IRi’s The State of the Snack Industry 2019, the percent of consumers snacking is up significantly since 2010. In the early morning, snacking is up from 7% in 2010 to 26% in 2019. In the afternoon, snacking is up from 51% in 2010 to 66% in 2019. In the late evening, snacking is up from 24% in 2010 to 40% in 2019. See Figure 8 for more details.
Figure 8: Percent of People Snacking at Different Times of the Day
Sources: New Constructs, LLC and IRi’s The State of the Snack Industry 2019.
Narrowing in on the snack nuts and nut industry, IRi notes the snack nut market grew 1.4% YoY in 2019, and sales of nutritional snacks and trail mixes grew 2.3% YoY. Mordor Intelligence, a market research provider, projects the global nut market will grow nearly 6% compounded annually through 2025.
Furthermore, we believe an economic recovery is likely over the long term as the International Monetary Fund (IMF) and nearly every economist in the world believe the global economy will grow strongly in 2021. The IMF estimates the global economy will expand by 5.4%, and the U.S. economy by 4.5%, in 2021. Fitch Ratings projects global GDP growth of 5.1% in 2021, and for “pre-virus levels of GDP” to be reached in mid-2022 in the US and later in Europe. The overall growth in the economy should further help bolster consumer packaged goods sales.
JBSS Trades Well Below Its Economic Book Value
Despite rebounding from its March lows, at $82/share JBSS still trades well below its 52-week high and below its economic book value, or no-growth value. At a price-to-economic book value (PEBV) ratio of 0.6, the market expects John B. Sanfilippo & Son’s NOPAT to permanently decline by 40%. This expectation seems overly pessimistic over the long term.
John B. Sanfilippo & Son’s current economic book value is $131/share – a 60% upside to the current price.
JBSS is not just historically cheap against its own economic book value, but also relative to industry peers.
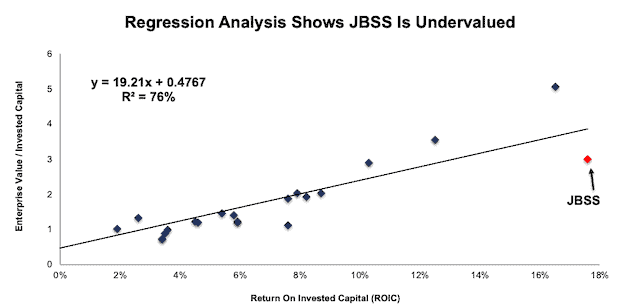
Per Figure 9, ROIC explains 76% of the difference in valuation for 23 different Packaged Food companies. JBSS trades at a discount to the group as shown by its position below the trend line.
Figure 9: ROIC Explains 76% of Difference in Valuation for Packaged Food Firms
Sources: New Constructs, LLC and company filings.
If the stock were to trade at parity with its peers, it would be worth $110/share – 34% above the current stock price.
John B. Sanfilippo & Son’s Current Price Implies Another Historical Drop in Profits
Below, we use our reverse DCF model to quantify the cash flow expectations baked into John B. Sanfilippo & Son’s current stock price. Then, we analyze the implied value of the stock based on different assumptions about COVID-19’s impact on consumer spending and John B. Sanfilippo & Son’s future growth in cash flows.
Scenario 1: Using historical revenue declines, historical margins, and average historical GDP growth rates, we can model the worst-case scenario already implied by John B. Sanfilippo & Son’s current stock price. In this scenario, we assume:
- NOPAT margins fall to 1.7% (lowest in company history, excluding negative margin in 2006/2007) in 2020-2022, and increase to 5% (equal to 2019, compared to 7% TTM) in 2023 and each year thereafter
- Revenue falls 20% (triple the YoY revenue decline in 2007 and well below consensus estimates for 2% revenue growth) in 2020 and does not grow until 2023
- Sales begin growing again in 2023, but only at 3.5% a year, which is equal to the average global GDP growth rate since 1961
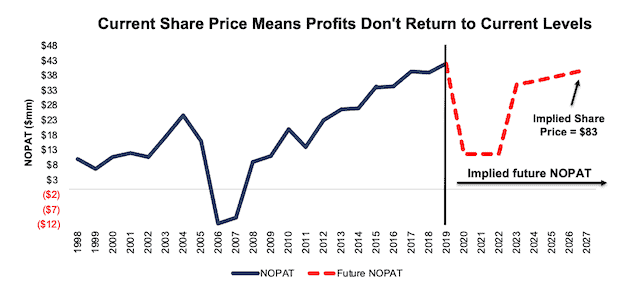
In this scenario, where John B. Sanfilippo & Son’s NOPAT declines 1% compounded annually over the next eight years (including a 72% YoY drop in 2020), the stock is worth $83/share today – nearly equal to the current stock price. See the math behind this reverse DCF scenario.
Figure 10 compares the firm’s implied future NOPAT in this scenario to its historical NOPAT. This worst-case scenario implies John B. Sanfilippo & Son’s NOPAT eight years from now will be 4% below its 2019 NOPAT. In other words, this scenario implies that eight years after the COVID-19 pandemic, John B. Sanfilippo & Son’s profits won’t have recovered to their current level. In any scenario better than this one, JBSS holds significant upside potential, as we’ll show.
Figure 10: Current Valuation Implies Severe, Long-Term Decline in Profits: Scenario 1
Sources: New Constructs, LLC and company filings.
Scenario 2: Moderate Long-Term Recovery Could Be Very Profitable
If we assume, as does the IMF and nearly every economist in the world, that the global economy rebounds and returns to growth starting in 2021, JBSS is undervalued.
In this scenario, we assume:
- NOPAT margins fall to 1.7% (lowest in company history, excluding negative margin in 2006/2007) in 2020 and rise to 5% (equal to 2019, compared to 7% TTM) in 2021 and each year thereafter
- Revenue falls 13% (double the YoY revenue decline in 2007) in 2020
- Revenue grows by 4.7% in 2021 and 4.8% in 2022 (consensus estimates), and 3.5% a year in 2023 and each year thereafter, which is equal to the average global GDP growth rate since 1961
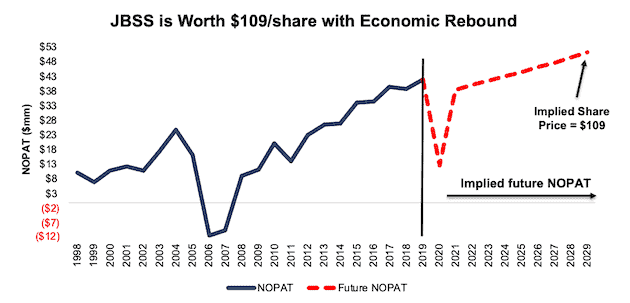
In this scenario, John B. Sanfilippo & Son’s NOPAT only grows by 2% compounded annually over the next decade (including a 70% YoY drop in 2020) and the stock is worth $109/share today – a 33% upside to the current price. See the math behind this reverse DCF scenario.
For comparison, John B. Sanfilippo & Son grew NOPAT by 15% compounded annually from 2008 to 2019 and 10% compounded annually over the past two decades. It’s not often investors get the opportunity to buy a strong firm in a growing industry at such a discounted price.
Figure 11 compares the firm’s implied future NOPAT in this scenario to its historical NOPAT.
Figure 11: Implied Profits Assuming Moderate Recovery: Scenario 2
Sources: New Constructs, LLC and company filings.
Sustainable Competitive Advantages Will Drive Shareholder Value Creation
Here’s a summary of why we think the moat around John B. Sanfilippo & Son’s business will enable it to continue to generate higher NOPAT than the current market valuation implies. The following competitive advantages help John B. Sanfilippo & Son survive the downturn and return to growth as the economy grows again:
- Strong balance sheet and available liquidity to survive any economic downturn
- Leading market share in recipe nuts and growing market share in newer products
- Greater capital efficiency and ROIC than its peers
- Executive compensation plan that incentivizes prudent capital management
What Noise Traders Miss with John B. Sanfilippo & Son
These days, fewer investors focus on finding quality capital allocators with shareholder friendly corporate governance. Instead, due to the proliferation of noise traders, the focus is on short-term technical trading trends while high-quality fundamental research is overlooked. Here’s a quick summary of what noise traders are missing:
- Strong core earnings growth over the past two decades
- Growing demand for snack nuts and nut products
- Valuation implies the economy never recovers and profits permanently decline by 40%
Dividends Provide Quality Yield
John B. Sanfilippo & Son has no share repurchase plan but, instead, returns capital to shareholders through annual and special dividends. The special dividend has been paid in each year since 2013, over which time it has increased from $1/share in 2013 to $2.40/share in 2019. The firm began paying a standard annual dividend in 2018, which has increased from $0.50/share to $0.60/share in 2019. If the firm were to maintain its annual and special dividend, investors benefit from a 3.7% dividend yield. In its fiscal 3Q20 conference call, the firm stated “we certainly are committed to paying our regular annual dividend in August.”
Most importantly, from 2015 to 2019, the firm generated more in in free cash flow ($200 million) than it paid out in dividends ($153 million), or an average $9 million surplus each year. Firms with cash flows greater than dividend payments have a higher likelihood to maintain and grow dividends.
A Consensus Beat or Signs of Recovery Could Send Shares Higher
According to Seeking Alpha data, consensus estimates (which are taken from only one analyst covering the firm) for John B. Sanfilippo & Son have actually risen in recent months, as the COVID-19 pandemic provided a boost to sales. At the end of January 2020, consensus estimates pegged John B. Sanfilippo & Son’s 2020 EPS at 4.10/share. Consensus estimates now expect 2020 EPS of $4.74/share. 2021 estimates follow a similar trend but actually remain below 2020 estimates. At the end of January, 2021 EPS consensus was $3.62/share, which is now $4.07/share.
These higher expectations should be no issue for a well-run business to beat consensus, if not this quarter, then maybe the next, especially if additional stay at home orders are issued and consumers stock up on food products again. Though our current Earnings Distortion Score, which is a short-term indicator of the likelihood to beat or miss expectations, for John B. Sanfilippo & Son is “In-line”, increased demand moving forward would make it much easier to beat earnings. John B. Sanfilippo & Son has beat earnings estimates in each of the past four quarters, and doing so again could send shares higher.
Lastly, while John B. Sanfilippo & Son may experience a temporary boost to sales during the pandemic, any clarity or signs of a recovery in the global economy would send shares higher over the long-term. A healthy economy, with ample consumer spending, provides the best long-term growth runway and opportunity for continued upward sales growth.
Insider Trading and Short Interest Trends
Over the past 12 months, insiders have bought 23 thousand shares and sold 63 thousand shares for a net effect of 40 thousand shares sold. These sales represent less than 1% of shares outstanding.
There are currently 523 thousand shares sold short, which equates to 6% of shares outstanding and just over six days to cover. Short interest is down 2% from the prior month, but still minimal.
Critical Details Found in Financial Filings by Our Robo-Analyst Technology
As investors focus more on fundamental research, research automation technology is needed to analyze all the critical financial details in financial filings as shown in the Harvard Business School and MIT Sloan paper, "Core Earnings: New Data and Evidence”.
Below are specifics on the adjustments we make based on Robo-Analyst findings in John B. Sanfilippo & Son’s 2019 10-K:
Income Statement: we made $10 million of adjustments, with a net effect of removing $3 million in non-operating expenses (<1% of revenue). You can see all the adjustments made to John B. Sanfilippo & Son’s income statement here.
Balance Sheet: we made $50 million of adjustments to calculate invested capital with a net increase of $33 million. One of the largest adjustments was $9 million in other comprehensive income. This adjustment represented 3% of reported net assets. You can see all the adjustments made to John B. Sanfilippo & Son’s balance sheet here.
Valuation: we made $93 million of adjustments with a net effect of decreasing shareholder value by $93 million. There were no adjustments that increased shareholder value. Apart from total debt, one of the most notable adjustments to shareholder value was $25 million in underfunded pensions. This adjustment represents 3% of John B. Sanfilippo & Son’s market cap. See all adjustments to John. B. Sanfilippo & Son’s valuation here.
Attractive Funds That Hold JBSS
The following funds receive our Attractive-or-better rating and allocate significantly to John B. Sanfilippo & Son:
- Invesco S&P Small Cap Consumer Staples ETF (PSCC) – 3.7% allocation and Attractive rating
- Invesco Dynamic Food & Beverage ETF (PBJ) – 3.1% allocation and Attractive rating
- James Micro Cap Fund (JMCRX) – 2.3% allocation and Attractive rating
- Royce Special Equity Fund (RYSEX) – 2.2% allocation and Very Attractive rating
This article originally published on July 13, 2020.
Disclosure: David Trainer, Kyle Guske II, and Matt Shuler receive no compensation to write about any specific stock, style, or theme.
Follow us on Twitter, Facebook, LinkedIn, and StockTwits for real-time alerts on all our research.
[1] Our core earnings are a superior measure of profits, as demonstrated in Core Earnings: New Data & Evidence a paper by professors at Harvard Business School (HBS) & MIT Sloan. The paper empirically shows that our data is superior to “Operating Income After Depreciation” and “Income Before Special Items” from Compustat, owned by S&P Global (SPGI).
