We published an update on this Long Idea on February 23, 2022. A copy of the associated Earnings Update report is here.
As markets continue to hit new highs, too many investors try to swing for the fences with stocks that trade at irrational valuations. Now is the time to be safe with your capital and find stocks that offer smart risk/reward.
This firm has a long history of profit growth, over four decades of dividend growth, and an executive compensation plan that properly incentivizes executives to create shareholder value. Add in a cheap valuation, and it’s clear why Kimberly-Clark Corp (KMB: $115/share) is this week’s Long Idea.
KMB’s Consistent Profit Growth
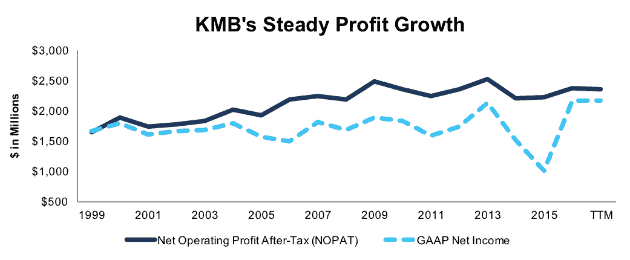
We briefly featured KMB in January 2015, and, while the stock is up just 6% (vs. +27% for the S&P), it remains undervalued and warrants a deeper look. KMB has grown revenue and after-tax profit (NOPAT) by just under 1% compounded annually over the past decade. More recently, NOPAT growth has ticked slightly higher, and grown by 1.2% compounded annually over the past five years, per Figure 1.
Despite its size, KMB has managed to continue growing profits in a challenging consumer environment. The consistent profit growth has been achieved through margin improvement. KMB’s NOPAT margin has improved from 11% in 2011 to 13% over the last twelve months.
Most impressive, and a testament to KMB’s well managed business, is that economic earnings have grown 5% compounded annually over the past decade.
KMB has also exhibited excellent stewardship of capital. Over the past five years, KMB has improved its return on invested capital (ROIC) from 12% in 2011 to 14% TTM. KMB’s consistent balance sheet efficiency is further evidence of good capital stewardship. Over the past decade, KMB’s invested capital turns have averaged 1.1, which is equal to KMB’s average invested capital turns over the last twelve months.
Figure 1: KMB’s Profit Growth Over Past 17 Years
Sources: New Constructs, LLC and company filings
KMB has generated a cumulative $13.5 billion (33% of market cap) of free cash flow (FCF) over the past five years. KMB’s $2.5 billion in FCF over the last twelve months equates to a 5% FCF yield compared to 2% for the average S&P 500 stock and 1% for the Consumer Staples sector.
Executive Compensation Plan Is a Hidden Strength
KMB’s executive compensation plan properly aligns executives’ interests with those of shareholders. Apart from base salary and annual cash bonuses, KMB executives receive long-term equity compensation in the form of performance based restricted stock units. These awards are tied to the achievement of two goals, 3-year average return on invested capital and annual net sales growth. Each goal is weighted at 50%. Stock options made up nearly 50% of the CEO’s pay in 2016 and dwarfs the annual salary and cash bonuses, which are not tied to ROIC.
The focus on improving ROIC aligns the interests of executives and shareholders and helps to ensure prudent stewardship of capital. KMB has averaged a 13% ROIC since 1998 and currently earns a 14% ROIC over the last twelve months. In addition, KMB has grown economic earnings 5% compounded annually over the last decade. The ability to grow economic earnings faster than NOPAT is not only rare, but also a direct result of KMB’s focus on improving ROIC and properly incentivizing executives to create shareholder value. KMB’s executive compensation plan also earns it a spot in November’s Exec Comp Aligned with ROIC Model Portfolio.
Improving ROIC Correlated with Creating Shareholder Value
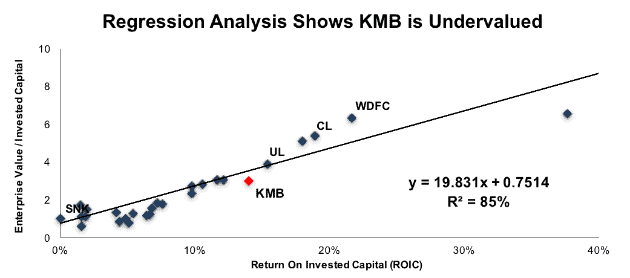
We know from Figure 2 below, and numerous case studies, that changes in stock prices are strongly correlated with ROIC. As such, getting ROIC right is an important part of the investment decision making process. A recent white paper published by accounting firm, Ernst & Young, shows material superiority of our forensic accounting research and measure of ROIC versus the largest research providers.
Per Figure 2, ROIC explains 85% of the difference in valuation for the 31 household & personal products peers under coverage. Despite KMB’s 14% ROIC, which is above the 11% average of the peer group, the firm’s stock trades at a discount to peers as shown by its position below the trend line in Figure 2.
Figure 2: ROIC Explains 85% Of Valuation for Household & Personal Products Stocks
Sources: New Constructs, LLC and company filings
If the stock were to trade at parity with its peers, it would be $139/share – 21% above the current stock price. Given the firm’s consistent ROIC and properly aligned executive compensation, one would think the stock would garner a premium valuation.
KMB’s Efficient Business Model Is Increasing Its Competitive Advantage
Kimberly-Clark generates its revenue in three segments: Personal Care (50%), Consumer Tissue (33%), and K-C Professional (17%). The Personal Care segment consists of industry leading brands such as Huggies, Kotex, and Depend while the Consumer Tissue segment contains brands such as Kleenex, Scott, and Cottonelle.
As an industry leader of consumer goods in these categories, KMB’s peers include similar consumer goods giants, such as Unilever (UL), The Clorox Company (CLX), Colgate Palmolive (CL), Johnson & Johnson (JNJ), and Procter & Gamble (PG), among others. Apart from branded competition, low-cost private labels represent an additional competitor.
As sales have stagnated across the industry, largely due to maturation the domestic market and inconsistent international growth, KMB has increased its profitability. Per Figure 3, KMB’s ROIC, which was well below its peer group in 2012, has consistenly improved and surpassed the peer group over the last twelve months.
Figure 3: KMB’s ROIC on the Rise
Sources: New Constructs, LLC and company filings.
This profitability growth is the result of a dedicated focus on cost-control and intelligent capital allocation. Since 2012, KMB has decreased SG&A from 19% of revenue to 18% and increased gross margins from 32% to 37%. These cost-cutting measures have helped the company buck the trend of falling margins in the rest of the industry, as shown in Figure 4.
Figure 4: KMB’s NOPAT Margin Advantage is Growing
Sources: New Constructs, LLC and company filings.
Moving forward, KMB’s higher margins allow the firm greater flexibility in continuing international expansion, investing in potential new product lines, and keeping prices competitive while remaining profitable.
Bear Case: No Room for Revenue Growth or Future Margin Improvement
Investors have extrapolated the “Amazon effect” from the consumer goods market into the Consumer Staples market, as Amazon and others introduce new private labels and low-cost goods. The concern is that these private labels will eat away at branded product margins and avenues for revenue growth.
While competition has impacted KMB’s revenue, margins remain strong, as noted in Figure 4 above. These concerns are not new, as KMB and other Consumer Staples providers have been battling low-cost products for years.
To grow revenues in the future, KMB is looking outside the United States and into developing and emerging markets. These markets are not as mature and should see increased consumption alongside economic growth in places like China, Brazil, and India. In 3Q17, KMB noted its developing and emerging markets organic revenue grew 3% year-over-year, with sales up double digits in places like Argentina and mid-single digits in China.
Rather than focus solely on revenue growth and beating competition on price, KMB has looked inward to streamline the business and position it for years of continued profit growth, even without international expansion. The company’s initiative, called FORCE (Focused on Reducing Costs Everywhere), has allowed KMB to cut costs across the business (such as eliminating waste or streamlining logistics) and expand margins. There may be a limit to how much cost-cutting can achieve, but we haven’t seen it yet. Moreover, the recent margin improvements (especially versus peers) prove the firm’s competency in cutting costs.
One final bear concern, and one more closely related to the Amazon effect rather than just industry impact, is KMB’s reliance on Wal-Mart (WMT). In 2016, sales to Wal-Mart stores represented 14% of KMB’s total sales. Revenue concentration can be concerning for smaller firms as they are susceptible to pricing pressure. However, with KMB’s global reach, it is less likely to be strong-armed into poor business terms. At the same time, we’ve long been on record that despite the market’s concerns, Wal-Mart remains best positioned to withstand Amazon’s impact on the retail industry and represents a strong partner for KMB.
Lastly, the bear case is further weakened by analyzing KMB’s valuation. The stock’s current valuation ignores KMB’s years of profit growth and significantly undervalues its business. More details are below.
Underperforming Share Price Creates Buying Opportunity
KMB is down 10% over the past six months and 15% since the 2017 high achieved in late February. The S&P, on the other hand, is up 7% over the past six months. The underperformance can be largely attributed to KMB’s position in the consumer goods industry, which has been beaten down on concerns of competition. However, KMB has continued to grow profits and the stock decline represents a disconnect between the fundamentals of the business and KMB’s valuation. This disconnect creates an excellent buying opportunity.
At its current price of $115/share, KMB has a price-to-economic book value (PEBV) ratio of 1.0. This ratio means the market expects no meaningful growth in KMB’s NOPAT over the remaining life of the firm. This expectation seems overly pessimistic for a firm that has grown NOPAT by 4% compounded annually since 1998.
If KMB can simply maintain NOPAT margins (13%) and grow NOPAT by just 2% compounded annually for the next decade, the stock is worth $141/share today – a 23% upside. Add in the potential 6% yield detailed below, and it’s clear why KMB could be a great portfolio addition.
Over Four Decades of Dividend Growth Provide Solid Yield
A long streak of dividend increases is widely considered to be a sign of a company’s strong competitive advantage. KMB has increased its dividend for 44 consecutive years and paid dividends continually since 1935. KMB’s current annualized dividend of $3.88/share equates to 6% compound annual growth in dividends since the $2.92 paid in 2012. The current dividend also equals a 3.4% dividend yield.
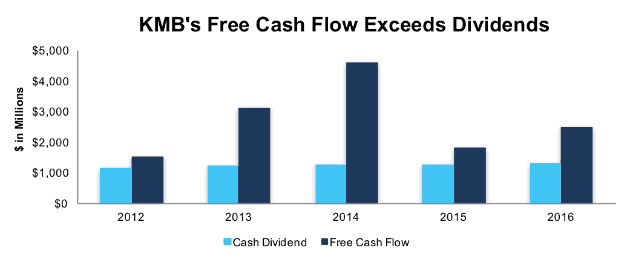
Per Figure 5, KMB has paid out cumulative dividends of $6.2 billion compared to cumulative cash flow of $13.5 billion over the past five years. KMB’s FCF over the trailing twelve months ($2.5 billion) equates to 181% of the annual cash dividend payment based on a $3.88/share annual dividend.
Figure 5: KMB Free Cash Flow Vs. Dividend Payments
Sources: New Constructs, LLC and company filings.
Companies with FCF well in excess of dividend payments provide higher quality dividend growth opportunities because we know the firm generates the cash to support the current dividend as well as a higher dividend. KMB also earned a spot in October’s Dividend Growth Stocks Model Portfolio given its ability to grow dividends for over four decades.
Total Shareholder Yield Approaches 6%
KMB repurchases stock pursuant to publicly announced repurchase programs. In 2015 and 2016, KMB repurchased $800 million and $750 million in shares respectively. Through the first nine months of 2017, KMB has repurchased $800 million and plans to purchase a total of $900 million in 2017. If KMB management repurchases the entire $900 million, it would equate to 2.2% of the current market cap. When combined with the 3.4% dividend yield, the total yield to shareholders approaches upwards of 5.6%.
Catalyst: Revenue Growth Could Boost Shares
KMB has missed revenue growth expectations in seven of the last eight quarters. Despite meeting or beating earnings expectations in six of these eight quarters, investors remain skeptical at KMB’s ability to create shareholder value moving forward. Delivering revenue growth could be the catalyst shares need to move higher and trade at a more reasonable level given KMB’s strong fundamentals.
Two recent events could provide just the spark needed to drive such revenue growth. In 3Q17, KMB purchased the remaining 50% of its joint venture in India. India represents an emerging market for KMB to tap into and owning its full operations in the country means the firm can maximize its experience gained through global expansion and aim to grow its market penetration in India.
Second, in an effort to capitalize on the rise of private labels, it has been reported that KMB is producing Amazon’s private label, “Mama Bear”, diapers. While KMB may be unable to stop the competition from private labels, the firm can participate in their success by continuing to produce the private label products. It is highly unlikely that Amazon will ever attempt to be a producer of goods.
Insider Trading and Short Interest Trends
There is little insight to be gained from recent insider trading trends. Insider activity has been minimal over the past twelve months with 135 thousand shares purchased and 257 thousand shares sold for a net effect of 122 thousand shares sold. These sales represent less than 1% of shares outstanding.
Short interest trends are more insightful. There are currently 13.8 million shares sold short, which equates to 4% of shares outstanding and just over 5 days to cover. Short interest has more than tripled from 4.7 million shares at the end of December 2016. However, KMB has proven its ability to consistently grow profits and now any positive earnings report could squeeze shorts and send shares even higher.
Auditable Impact of Footnotes & Forensic Accounting Adjustments
Our Robo-Analyst technology enables us to perform forensic accounting with scale and provide the research needed to fulfill fiduciary duties. In order to derive the true recurring cash flows, an accurate invested capital, and an accurate shareholder value, we made the following adjustments to Kimberly-Clark’s 2016 10-K:
Income Statement: we made $1.1 billion of adjustments, with a net effect of removing $205 million in non-operating expense (1% of revenue). We removed $472 million in non-operating income and $677 million in non-operating expenses. You can see all the adjustments made to KMB’s income statement here.
Balance Sheet: we made $8.2 billion of adjustments to calculate invested capital with a net increase of $8.1 billion. The most notable adjustment was $3.5 billion in other comprehensive income. This adjustment represented 40% of reported net assets. You can see all the adjustments made to KMB’s balance sheet here.
Valuation: we made $10.3 billion of adjustments with a net effect of decreasing shareholder value by $10.3 billion. There were no adjustments that increased shareholder value. Apart from $8.2 billion in total debt, which includes $521 million in off-balance sheet operating leases, the largest adjustment was $1.4 billion in underfunded pensions. This pension adjustment represents 3% of KMB’s market cap. Despite the net decrease in shareholder value, KMB remains undervalued.
Attractive Funds That Hold KMB
The following funds receive our Attractive-or-better rating and allocate significantly to KMB.
- Westcore Large-Cap Dividend Fund (WILGX) – 3.8% allocation and Very Attractive rating.
- FundVantage Trust: Quality Dividend Fund (QDVIX) – 3.8% allocation and Attractive rating.
- Matrix Advisors Dividend Fund (MADFX) – 3.6% allocation and Very Attractive rating.
- American Beacon Alpha Quant Quality Fund (AQQIX) – 3.3% allocation and Attractive rating.
- Independent Franchise Partners US Equity Fund (IFPUX) – 3.0% allocation and Attractive rating.
This article originally published on November 15, 2017.
Disclosure: David Trainer, Kyle Guske II, and Sam McBride receive no compensation to write about any specific stock, style, or theme.
Follow us on Twitter, Facebook, LinkedIn, and StockTwits for real-time alerts on all our research.
Click here to download a PDF of this report.
Photo Credit: Tookapic (Pexels)


