
After falling to $18 billion at the beginning of the COVID-19 pandemic, early reports indicate Airbnb (ABNB: $30 billion rumored valuation) will fetch a $30 billion valuation for its upcoming IPO.
At that price, the stock will earn our Unattractive rating, but if Airbnb can continue to execute as it has to date, we think the firm could achieve the future cash flow expectations implied by a $30 billion valuation.
Unlike other recent IPOs, and several stocks where valuations are sky-high, Airbnb has a plausible path to profitability and growth beyond that if the firm’s management can:
- Maintain its newly lowered cost structure to improve margins
- Leverage its large global footprint of hosts to meet consumer lodging demand
- Leverage its scale and network effects to grow its footprint with minimal extra cost.
This report aims to help investors sort through Airbnb’s financial filings to understand the fundamentals and valuation of this upcoming IPO.
Lack of Consistent Profitability
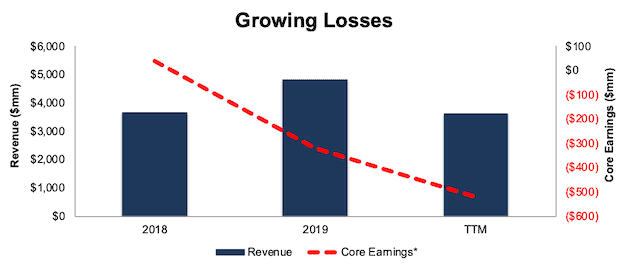
Given the COVID-19 pandemic’s impact on global travel, it’s not surprising that Airbnb’s revenue and GAAP results fell precipitously in the first half of the year. A rebound in customer travel drove the firm’s GAAP profits in 3Q20 (the fourth quarter of GAAP profits in past 11 quarters), but it was not enough to reverse the downward trend in the company’s core earnings[1]. Per Figure 1, Airbnb’s core earnings fell from $37 million in 2018 to -$319 million in 2019. Core earnings fell further, to -$520 million, over the TTM.
Figure 1: Airbnb’s Core Earnings and Revenue: 2018-TTM
Sources: New Constructs, LLC and company filings
*Airbnb’s TTM core earnings is estimated assuming the firm’s core earnings deteriorated at the same rate as the firm’s income from operations from 2019 to the TTM period. We make this assumption as there is not enough information in the S-1 to definitively calculate core earnings over the TTM period.
COVID Provided Chance to Cut Costs, but Profitability Still Lags
When the COVID-19 pandemic nearly brought global travel to a halt, it forced Airbnb to “right-size” its operations. To do so, Airbnb laid off nearly 25% of its workforce in May 2020 and significantly curtailed sales and marketing spend (down 54% YoY through first nine months of 2020).
Such actions helped drive the firm’s most recent quarter of GAAP profits and present a clearer path to profitability moving forward, given that the firm was still able to drive users to the platform with lower marketing spend. For instance, sales & marketing expenses fell <1% from 2Q20 to 3Q20, but nights and experiences booked more than doubled over the same time.
Airbnb expects sales & marketing expenses to decline as a percent of revenue as the firm shifts its marketing approach to attract more users via direct and unpaid channels and less from more costly search engine optimization and other performance marketing channels. Should this shift in marketing result in a more profitable business, it would be welcome news to Airbnb investors, given the firm’s current negative profitability.
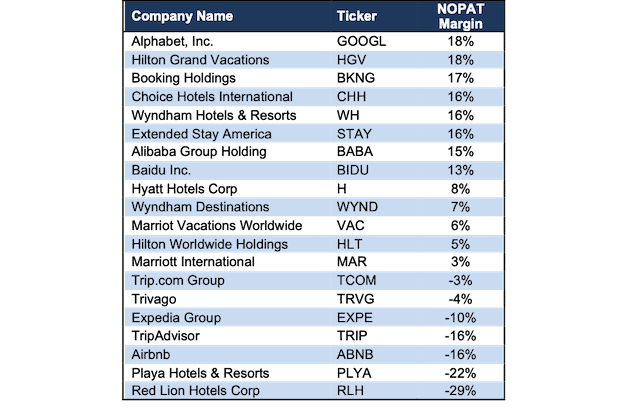
Per Figure 2, the only firms with worse TTM net operating profit after-tax (NOPAT) margins than Airbnb’s are Playa Hotels & Resorts (PLYA) and Red Lion Hotels (RLH). In 2019, Airbnb’s NOPAT margin ranked last among the firms in Figure 2, which include firms Airbnb lists as competitors in its S-1, such as Alphabet (GOOGL), Booking Holdings (BKNG), Trip.com (TCOM), Expedia (EXPE), Marriott International (MAR), and Hilton Worldwide Holdings (HLT), as well as additional hotel operators under coverage.
Figure 2: Airbnb’s Profitability Vs. Peers: TTM Period
Sources: New Constructs, LLC and company filings
*Airbnb’s TTM NOPAT margin is estimated assuming the firm’s NOPAT improved at the same rate as the firm’s income from operations from 2019 to the TTM period. We make this assumption as there is not enough information in the S-1 to definitively calculate NOPAT over the TTM period.
Airbnb’s Network Could Provide Significant Scale Advantages
Airbnb’s existing platform of property owners and room listings creates a true network effect that could provide greater scale advantages. In essence, the more listings available on the platform, the more consumers will look to Airbnb first, which will drive more property owners to the platform to reach the largest audience. As Airbnb states, “guests attract hosts, and hosts attract guests.”
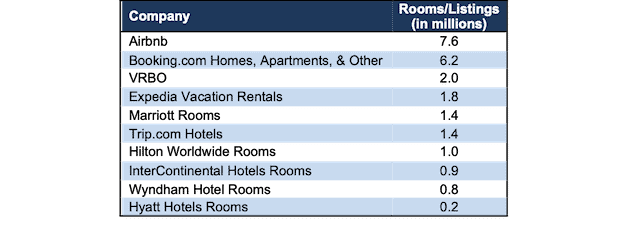
Per Figure 3, Airbnb already has the largest platform for room listings of its many competitors, including significant size advantages over more traditional hotel room providers. Scale advantages were often a bull argument for investing in tech startups Uber (UBER) and Lyft (LYFT). However, the benefits were largely overstated, as the firms offer a largely commoditized service, taxi rides and delivery, that isn’t unique to either business. Airbnb, on the other hand, truly benefits from scale, as with each new listing, it becomes easier, and theoretically cheaper, to attract users, and vice versa.
Further benefitting Airbnb during the COVID-19 pandemic is the rise in demand for short-term rentals over hotels when choosing somewhere to stay. Should the COVID-19 pandemic cause a permanent shift in consumer behavior (some industry forecasts don’t expect hotel demand to fully return until 2023), Airbnb could stand to reap the benefits given its larger scale compared to peers.
Figure 3: Airbnb’s Available Listings vs. Competitors
Sources: New Constructs, LLC and company filings
Regulations Remain a Big Risk
Regardless of the network effects or scale advantages, Airbnb’s business is still highly susceptible to local, state, and country regulations across the globe. Some locations have deemed the business of providing homes/apartments for short-term rental illegal and instituted outright bans on the practice.
The risk of future regulations in any of the 100,000 cities Airbnb operates could materially impact the business’ operations. For example, Airbnb notes in its S-1 that upcoming regulations in New York (2% of revenue in 2019) could result in revenue from listings in the state to substantially decline due to the departure of hosts who do not wish to share their data with the city.
In its S-1, the firm includes a long list of regulations (Page 217-219) in the 10 largest cities in which it operates. This list provides insight into the challenges facing Airbnb’s business model going forward. While no one can be certain of how upcoming regulation will go, any additional regulations, especially those that make it harder for hosts to offer their homes for rent adds a level of risk to Airbnb’s IPO.
What Is Airbnb Really Worth?
Consider that Airbnb’s expected IPO valuation of $30 billion is only slightly higher than the $25 billion expected valuation of DoorDash, which is a much worse business that has no clear path to profitability.
We’re not saying the firm is undervalued at $30 billion, but when we use our reverse DCF model to analyze the future cash flow expectations baked into ABNB, they don’t seem nearly as unrealistic relative to other IPOs we’ve covered. Below we model two different scenarios to determine what ABNB should be worth, based on growth in future cash flows.
Scenario 1: we assume Airbnb is able to maintain revenue growth similar to before the COVID-19 pandemic, while successfully lowering its marketing expenses and achieving margins on par with Trip.com, a middle-of-the pack performer among peers listed above. Specifically, we assume Airbnb can:
- Gradually improve its NOPAT margin to 9% over four years, compared to -8% in 2019 and -16% over the trailing-twelve months
- Trip.com’s (TCOM) 2019 NOPAT margin was 9%
- Grow revenue by 32% compounded annually for the next five years (equal to 2019 YoY revenue growth rate).
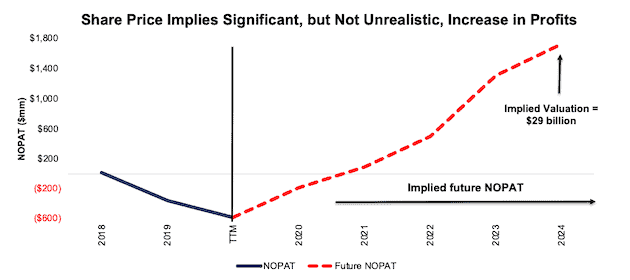
See the math behind this reverse DCF scenario. In this scenario, Airbnb would earn over $19 billion in revenue in 2024. At its TTM take rate, or the revenue generated per gross booking value (total sales on the platform), this scenario equates to ~$141 billion in gross booking value (GBV) in 2024.
For reference, Airbnb estimates its total addressable market (TAM), which includes spending on short-term stays, long-term stays, and experiences, is $3.4 trillion. In other words, Airbnb’s expected IPO valuation implies it will grow its GBV from <1% of its TAM in 2019 to 4% of its TAM in 2024. Such expectations aren’t nearly as unrealistic as other IPOs. For comparison, DoorDash’s valuation implies it will capture 72% of its TAM.
Figure 4 compares the firm’s implied future NOPAT in this scenario to its historical NOPAT.
Figure 4: Implied NOPAT in DCF Scenario 1
Sources: New Constructs, LLC and company filings.
Scenario 2: we assume Airbnb doubles down on cost efficiency – while sacrificing some revenue growth in the process – to achieve profitability on par with Booking Holdings, the most profitable travel firm in Figure 2. In such a scenario, ABNB has significant upside from its expected IPO valuation.
Specifically, we assume Airbnb can:
- Gradually improve its NOPAT margin to 28% over the next five years
- 28% NOPAT margin is equal to Booking Holdings’ average NOPAT margin over the past 10 years
- Grow revenue by 20% compounded annually for the next five years, which equals Booking Holdings’ revenue CAGR over the past decade.
In this scenario, ABNB is worth $56 billion today – an 87% upside to the expected IPO valuation. See the math behind this reverse DCF scenario. In scenario 2, Airbnb’s revenue grows to $12 billion in 2024, which means its implied GBV is still just 3% of its TAM.
While such a scenario may prove too optimistic, it illustrates that ABNB is not significantly overpriced at its expected IPO valuation. The valuation does assume growth in travel spending returns to some level of normalcy and Airbnb’s management can execute, which is not a slam dunk.
Each of the above scenarios also assumes Airbnb’s working capital and fixed assets increase YoY at a rate equal to 6% of revenue. This growth in invested capital equals the YoY change in invested capital as a percent of revenue in 2019. If the firm is able to grow revenue, NOPAT, and free cash flow (FCF) more efficiently, shares could have even greater upside.
IPO Is Not Without Warning Flags
Despite a more reasonable valuation than some recent IPOs, investors should be aware that Airbnb’s S-1 is not absent some notable red flags.
Public Shareholders Have No Rights
A risk of investing in Airbnb’s IPO is the fact that that the shares sold provide little to no say over corporate governance.
Airbnb is going public with 4 separate share classes, each with different voting rights. Airbnb’s IPO is only for class A shares, with one vote per share. Class B shares have 20 votes per share and are held by the co-founders and early investors. Class C and Class H shares have no votes per share.
While we won’t know the exact voting power of the co-founders until Airbnb provides additional information, it’s clear that a few select executives will control the firm. As stated in the S-1:
“the holders of our Class B common stock collectively will continue to control a significant percentage of the combined voting power of our common stock and therefore will be able to control all matters submitted to our stockholders for approval…”
Additionally, the founders have entered into a voting agreement in which they agree to vote all shares for the election of each individual founder to Airbnb’s board of directors and against their removal.
Ultimately, this multi-class structure gives investors little recourse to hold executives accountable.
Executive Compensation Is Focused on the Wrong Metric
Prior to IPO, Airbnb’s board of directors worked with a compensation consultant to build a new compensation plan for CEO Brian Chesky. Through this work, the board agreed to provide 100% of the CEO’s compensation in restricted stock units. These RSUs will only vest if Airbnb’s stock price reaches target price levels over the next decade.
Other executives receive cash bonuses that are tied to a litany of pre-established company goals such as guest and host identify verification, infrastructure and site performance improvements, diversity priorities, nights booked growth, adjusted EBITDA, and more.
Airbnb’s board chose to pay executives based on metrics that don’t align executives’ interests with shareholders’ interests. We know the use of misleading non-GAAP metrics can result in soaring executive compensation alongside shareholder value destruction.
Airbnb should link executive compensation with improving ROIC, which is directly correlated with creating shareholder value, so shareholders’ interests are properly aligned with executives’.
Insiders Trying to Dump Shares on Retail Investors?
It’s important to understand why a company goes public. For a firm like DoorDash (DASH), which we recently named the most ridiculous IPO of 2020, it makes sense to go public while demand for food delivery is at an all-time high. On the flip side, it seems like strange timing for a travel firm to IPO in the middle of one of the worst stretches for global travel in decades.
Reporting by the Wall Street Journal may provide the answer to “why” Airbnb is going public now. Early investors and employees have been applying pressure on Airbnb’s CEO to go public this year, as they’re set to lose their stock options next year.
We Don’t Really Know If We Can Trust the Financials
Investors should take Airbnb’s GAAP numbers with a grain of salt because neither management nor its auditors have performed an evaluation of the firm’s internal control over financial reporting. However, Airbnb does disclose that they previously identified a material weakness in internal control over financial reporting for the year ending December 31, 2017. The weakness was remediated as of December 31, 2018 but given the lack of up to date auditor’s opinion, investors cannot be sure such an issue won’t resurface. In fact, the firm notes specifically: “we can give no assurance that additional material weaknesses will not be identified in the future.”
Chosen Non-GAAP Metrics Aren’t Great
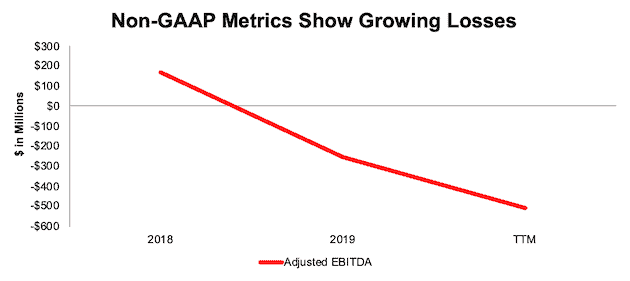
Despite reporting positive GAAP net income in the quarter ended September 30, 2020, Airbnb’s chosen non-GAAP metric, adjusted EBITDA, shows the firm’s losses are only growing. Adjusted EBITDA is every unprofitable company’s favorite metric because it allows management significant leeway in excluding costs in its calculation. For example, Airbnb’s adjusted EBITDA calculation removes stock-based compensation expense and a generic “Other” expense line item in addition to interest, taxes, depreciation and amortization.
Over the trailing twelve months, Airbnb removed $144 million (4% of TTM revenue) in Other expense and $136 million (4% of TTM revenue) in stock-based compensation. In total, Airbnb’s TTM adjusted EBITDA excludes $542 (15% of TTM revenue) in expenses. Even so, the firm’s adjusted EBITDA has worsened from $171 million in 2018 to -$507 million TTM, per Figure 5.
However, in 3Q20, after the firm’s significant cost cuts, adjusted EBITDA was $501 million, which could be a sign of future potential if Airbnb maintains effective cost controls.
Figure 5: Adjusted EBITDA Since 2018
Sources: New Constructs, LLC and company filings.
Critical Details Found in Financial Filings by Our Robo-Analyst Technology
As investors focus more on fundamental research, research automation technology is needed to analyze all the critical financial details in financial filings as shown in the Harvard Business School and MIT Sloan paper,"Core Earnings: New Data and Evidence”.
Below are specifics on the adjustments we make based on Robo-Analyst findings in Airbnb’s S-1:
Income Statement: we made $525 million of adjustments, with a net effect of removing $313 million in non-operating expenses (9% of revenue). You can see all the adjustments made to Airbnb’s income statement here.
Balance Sheet: we made $3.1 billion of adjustments to calculate invested capital with a net decrease of $2.8 billion. One of the most notable adjustments was $2.8 billion in excess cash. This adjustment 92% of reported net assets. You can see all the adjustments made to Airbnb’s balance sheet here.
Valuation: we made $9.7 billion of adjustments with a net effect of decreasing shareholder value by $4.1 billion. The largest adjustment to shareholder value was $3.2 billion in preferred capital. This adjustment represents 11% of Airbnb’s expected valuation. See all adjustments to Airbnb’s valuation here.
This article originally published on November 25, 2020.
Disclosure: David Trainer, Kyle Guske II, and Matt Shuler receive no compensation to write about any specific stock, style, or theme.
Follow us on Twitter, Facebook, LinkedIn, and StockTwits for real-time alerts on all our research.
[1] Our core earnings are a superior measure of profits, as demonstrated in Core Earnings: New Data & Evidence a paper by professors at Harvard Business School (HBS) & MIT Sloan and the Journal of Financial Economics. The paper empirically shows that our data is superior to “Operating Income After Depreciation” and “Income Before Special Items” from Compustat, owned by S&P Global (SPGI).