Value investing isn’t dead, but the traditional value screens – such as price-to-book – often lead to the wrong stocks.
As we wrote in “Danger Zone: Traditional Value Investors,” price-to-book screens can easily miss high-quality, undervalued stocks. This week’s Long Ideas are two stocks that have expensive price-to-book ratios but are undervalued: Meritor Inc. (MTOR: $22/share) and Raytheon Company (RTN: $184/share).
Price-to-Book Misses Undervalued Companies
We’ve covered the many flaws in price-to-book (P/B) ratios here. Instead of focusing on P/B, investors should use price-to-economic book value (PEBV), a better measure of value. Rather than relying on unscrubbed accounting data, economic book value is derived from our best-in-class after tax operating profit (NOPAT) and weighted average cost of capital (WACC).
Figure 1: Price-to-Book Makes Cheap Stocks Look Expensive

Sources: New Constructs, LLC and company filings.
Both MTOR and RTN have P/B ratios above the S&P 500 market average but below average PEBV ratios, per Figure 1. When coupled with strong fundamentals, this disconnect creates the opportunity for investors to buy quality companies at undervalued prices.
Meritor Inc. (MTOR)
With its P/B ratio of 5.6 (above the S&P 500 average of 3.3), MTOR is unlikely to pass traditional value screens. According to ETF.com, only four out of 49 (8%) ETFs that allocate to MTOR are classified as “Value” funds.
MTOR is down 3% (vs. S&P +3%) over the past year. GAAP net income understates MTOR’s profitability, which may be leading the market to undervalue the stock.
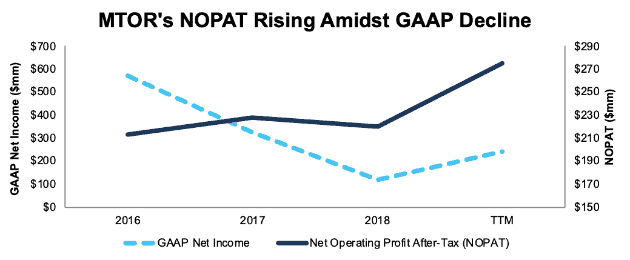
GAAP Understates True Profits: Since fiscal 2016, MTOR’s GAAP net income has fallen 25% compounded annually while NOPAT has grown 9% compounded annually, per Figure 2.
Figure 2: MTOR’s GAAP Net Income Masks Rising Profits

Sources: New Constructs, LLC and company filings.
From the fiscal 2018 10-K, one of the largest income statement adjustments we made is the removal of $126 million (108% of GAAP net income) in non-operating expenses due to legislative changes related to U.S. tax reform.
This adjustment led NOPAT to be 88% higher than GAAP net income in 2018. Even more impressively, MTOR was able to generate higher NOPAT without significantly increasing its capital base. Over the trailing twelve months (TTM), MTOR’s invested capital grew just 6% YoY while TTM NOPAT grew 11% YoY.
After calculating NOPAT, we must account for hidden assets and liabilities overlooked by accounting book value to calculate economic book value. MTOR’s book value also does not account for many of the intangible assets – decade-long relationships with truck manufacturers, industry knowledge, and trusted/reliable brand name – that help MTOR maintain its industry leading positions across its business segments.
When calculating EBV, we make the same adjustments to all companies to ensure comparability. For MTOR, we removed over $982 million (44% of EBV) in total debt, which includes $79 million in off-balance sheet operating leases, and $116 million (5% of EBV) in underfunded pensions. Even after subtracting these items, MTOR’s valuation still looks cheap given its strong fundamentals.
Strong Competitive Position: MTOR is well positioned to capitalize on rising freight demand and the electrification of automobiles. MTOR estimates they are the leading supplier of heavy-duty commercial axles in North America, South America, and Europe. Its customer portfolio includes the two largest truck manufacturers, Daimler AG and AB Volvo, in addition to many others such as PACCAR (PCAR) and Peterbilt.
Most importantly, it’s building products to meet the needs of the growing shift to electric vehicles. Leveraging its existing expertise in the space, the company currently has programs across the globe providing parts, such as front/rear suspensions, drum and disc brakes, and gearboxes, to electric vehicle manufacturers. In 2018, MTOR sold electric vehicle parts for Daimler Trucks North America, Thomas Built Bus, and Peterbilt. Using the company’s Blue Horizon platform, the company will supply Peterbilt with all-electric drivetrain systems for tractors and trucks, such as the recently announced all-electric 220EV.
Don’t Overlook Undervalued Shares: With GAAP net income in decline since 2016 (even after the recent TTM increase) and a P/B ratio above the market average, value investors could easily overlook MTOR. However, after removing accounting distortions and analyzing the expectations for future cash flows implied by the stock price, we find that MTOR provides excellent risk/reward.
At its current price of $22/share, MTOR has a PEBV of 0.8. This ratio means the market expects MTOR’s NOPAT to permanently decline by 20%. This expectation seems rather pessimistic given that MTOR has grown NOPAT by 9% compounded annually since 2016 and 13% compounded annually since 2009.
Even if we assume MTOR’s NOPAT stagnates, the current economic book value, or no-growth value of the stock, is $27/share – a 23% upside from the current price.
If we assume MTOR can maintain TTM margins (6%) and grow NOPAT by just 5% compounded annually for the next decade, the stock is worth $30/share today – a 36% upside. See the math behind this dynamic DCF scenario.
Raytheon Company (RTN)
With its P/B ratio of 4.5 (above the S&P 500 average of 3.3), RTN is unlikely to pass traditional value screens as well. In fact, according to ETF.com, fewer than 10 (out of 178) ETFs that allocate to RTN are classified as “Value” funds.
RTN is down 15% (vs. S&P +3%) over the past year. Given its strong fundamentals, this decline makes the stock look cheap, despite traditional valuation metrics showing the opposite.
GAAP Understates True Profits: RTN’s 2018 GAAP net income understates NOPAT. This disconnect is largely attributable to non-operating expenses, such as $1.2 billion (42% of GAAP net income) in non-operating pensions costs.
In total, we identified $512 million in net non-operating expenses that must be removed from GAAP net income to calculate RTN’s true profits. After these adjustments, we calculate that NOPAT is actually 18% higher than GAAP net income.
Calculating NOPAT is only one piece of the equation for finding real value. One must also account for changes in the balance sheet to get the complete picture of a company’s operations. Items such as off-balance sheet debt, excess cash, deferred tax assets, and more represent hidden assets and liabilities that accounting book value overlooks. In 2018, the largest item we removed from reported net assets was $2.9 billion (12% of reported net assets) in excess cash. In addition, RTN’s book value does not account for many of the intangible assets – government relationships, technical expertise, and more – that are required to succeed in the Defense industry.
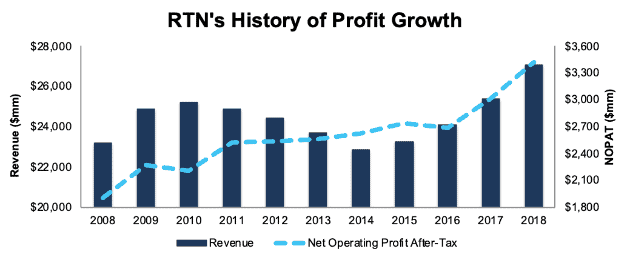
History of Strong Fundamentals: Over the past decade, RTN’s revenue grew 2% compounded annually while NOPAT grew 6% compounded annually, per Figure 3. The company’s NOPAT margin increased from 8% in 2008 to 13% in 2018 while its ROIC improved from 8% to 10% over the same time.
Figure 3: RTN’s NOPAT Growth Since 2008

Sources: New Constructs, LLC and company filings.
The history of strong fundamentals looks poised to continue as well. RTN reported record bookings, the value of orders awarded during the year, of $32.2 billion in 2018, which was up 16% YoY. RTN’s total backlog, the value of all orders on which work has not yet been performed, ended the year at a record $42.4 billion, up 11% YoY. Furthermore, domestic defense spending is expected to rise as the U.S. looks to update older equipment while foreign governments (30% of RTN revenue came from international customers in 2018) ramp up their spending.
Don’t Overlook Undervalued Shares: Any metric that relies on unscrubbed accounting data will lead investors astray. The research we do to remove accounting distortions and measure the expectations implied by the stock price reveals that RTN is significantly undervalued.
At its current price of $184/share, RTN has a price-to-economic book value (PEBV) ratio of 1.1. This ratio means the market expects RTN’s NOPAT to grow by no more than 10% over the remainder of its corporate life. This expectation seems pessimistic given that RTN has grown NOPAT by 6% compounded annually over the past decade and 5% compounded annually over the past two decades.
If RTN can maintain 2018 margins (13%) and grow NOPAT by just 4% compounded annually for the next decade, the stock is worth $233/share today – a 26% upside. See the math behind this dynamic DCF scenario.
Lastly, investors can rest easy knowing that their interests’ are also aligned with Raytheon’s executives’ interests. 50% of executives’ long-term equity incentives are tied to ROIC. ROIC has been a part of Raytheon’s executive compensation plan in some form since 2006. The focus on improving ROIC is directly correlated with improving shareholder value, helps to ensure prudent stewardship of capital, and lowers the risk of investing in the business.
This article originally published on March 6, 2019.
Disclosure: David Trainer, Kyle Guske II, and Sam McBride receive no compensation to write about any specific stock, sector, style, or theme.
Follow us on Twitter, Facebook, LinkedIn, and StockTwits for real-time alerts on all our research.
