
Just as our Core Earnings[1] better represent the true earnings of companies in the S&P 500 than GAAP earnings, our measure of free cash flow (“True FCF”) is also better than the “Traditional FCF”. Below, we feature the firms[2] and sectors (excluding Financials[3]) with the most overstated and understated FCF in the S&P 500.
S&P 500 Constituents With the Most Under/Overstated FCF
Overall, Traditional FCF for the S&P 500 understates True FCF by more than $105 billion, or 22% of Traditional FCF, over the trailing-twelve-months (TTM) for non-financial firms.
Figure 1 shows the S&P 500 companies with the most understated and overstated FCF (in total dollars) over the TTM. We detail the differences between True and Traditional FCF for Pfizer (PFE) and AbbVie (ABBV) below.
Figure 1: S&P 500 Companies with Most Under/Overstated Free Cash Flow: TTM
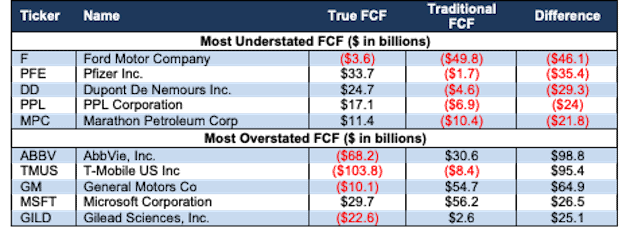
Sources: New Constructs, LLC and company filings.
Formula for True FCF Is Simple, But Finding Necessary Data is Hard
Here are the formulas we use for Traditional FCF and True FCF.
Traditional FCF:
EBIT[4] - Taxes - Change in Working Capital + Depreciation and Amortization - CAPEX - Acquisitions
True FCF:
Net Operating Profit After Tax (NOPAT) - Change in Invested Capital
Or
NOPAT - Change in Adjusted Working Capital - Change in Adjusted Fixed Assets[5]
Traditional FCF Is Materially Different From True FCF
Unlike Traditional FCF, our calculation of free cash flow is more comprehensive and accounts for:
- hidden non-operating income,
- changes in reserves,
- excess cash,
- asset write-downs,
- accumulated other comprehensive income (OCI),
- off-balance sheet debt, and
- numerous other adjustments
We make each of these adjustments to the income statement and balance sheet when calculating True FCF. Just as with our Core Earnings data and research, our FCF calculation leverages more reliable fundamental data[6] that enables investors to overcome flaws with legacy fundamental datasets.
While the calculation for True FCF looks simple, finding all the hidden and reported items required to eliminate accounting loopholes, often buried in footnotes & MD&A of financial filings, is much more difficult.
Pfizer’s True FCF Is Understated by $35 Billion
Pfizer’s True FCF accounts for 51% of the Healthcare sector True FCF and is understated by more than $35 billion, or 2,025% of Traditional FCF. Figure 2 shows Pfizer’s True FCF and Traditional FCF moving in opposite directions since 2019.
Figure 2: Pfizer: True FCF Vs. Traditional FCF: 2019-TTM
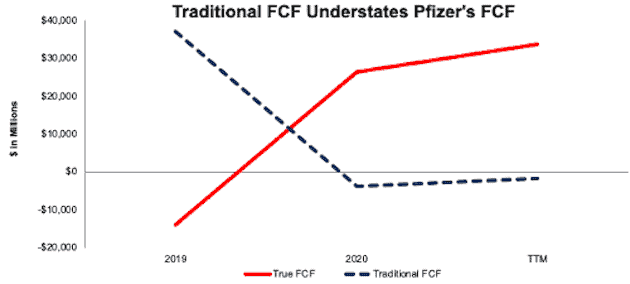
Sources: New Constructs, LLC and company filings.
The differences between True FCF and Traditional FCF are driven by the differences between:
- NOPAT and EBIT
- Change in net working capital vs. change in adjusted net working capital, and
- the change in adjusted fixed assets vs. depreciation and amortization - CAPEX - acquisitions.
The following is a summary of these differences when calculating Pfizer’s TTM FCF:
- The difference between NOPAT and EBIT is $288 million:
- $156 million in non-operating expense hidden in operating earnings, consisting of
- $238 million in implementation costs – 2020 10-K Page 70
- -$40 million in sublease income – 2020 10-K Page 97
- $10 million in cost of sales – 1Q21 10-Q Page 14
- -$3 million in additional depreciation – asset restructuring – 2020 10-K Page 70
- $63 million in asset write-downs hidden in operating earnings
- $46 million in asset write-offs and impairments – 1Q21 10-Q Page 9
- $23 million in additional depreciation – asset restructuring – 2020 10-K Page 70
- $62 million in interest for the present value of operating leases
- $156 million in non-operating expense hidden in operating earnings, consisting of
- The difference between change in net working capital and adjusted net working capital is $15.1 billion.
- The difference between change in adjusted fixed assets vs. depreciation and amortization - CAPEX - acquisitions is $21.2 billion.
Figure 3 reconciles Pfizer’s True FCF and Traditional FCF and details each of the differences listed above.
Figure 3: Pfizer: True FCF Vs. Traditional FCF Detailed Comparison[7]
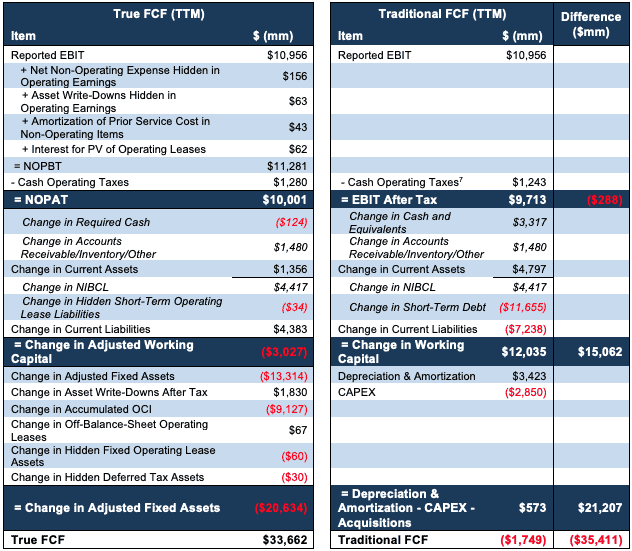
Sources: New Constructs, LLC and company filings.
AbbVie’s FCF Is Most Overstated in the S&P 500
AbbVie’s FCF is overstated by more than $98 billion, or 328% of Traditional FCF, over the TTM, the most of all non-financial S&P 500 firms over the TTM. Since 2019, AbbVie’s True FCF fell from $11.1 billion to -$68.2 billion TTM, while Traditional FCF rose from -$21.9 billion to $30.6 billion TTM.
Figure 4: AbbVie: True FCF Vs. Traditional FCF: 2019-TTM
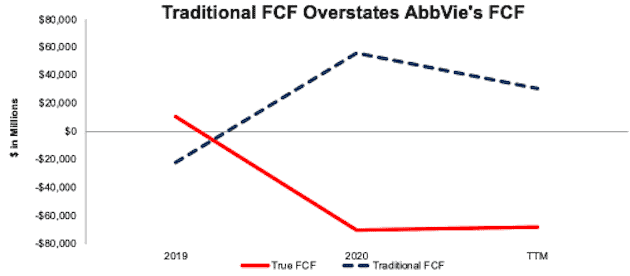
Sources: New Constructs, LLC and company filings.
The following is a summary of the differences between the two calculations of AbbVie’s TTM FCF:
- The difference between NOPAT and EBIT is $1.6 billion:
- $1.6 billion net non-operating expense hidden in operating earnings
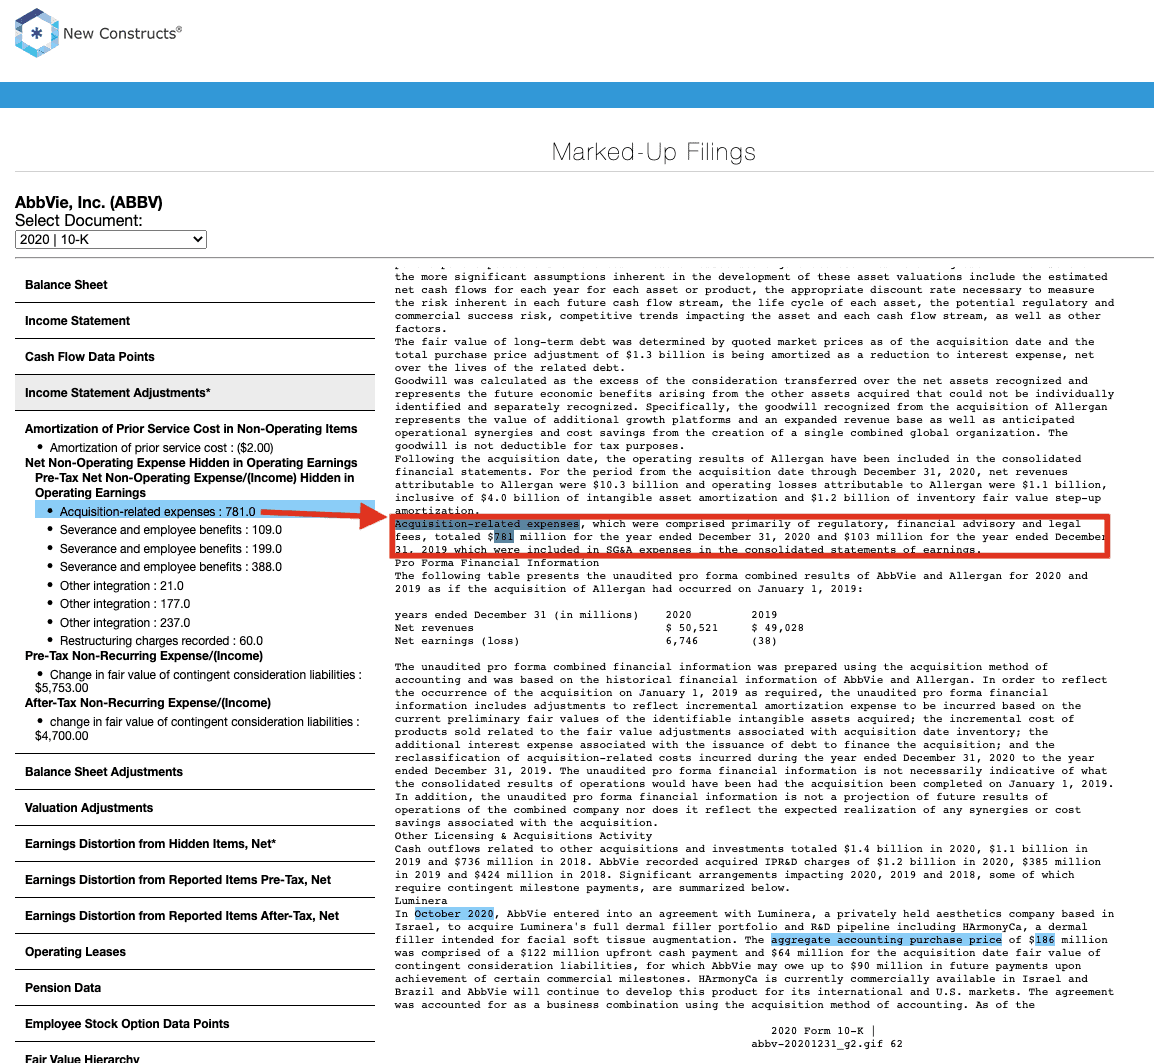
- $781 million in acquisition-related expenses – 2020 10-K Page 62
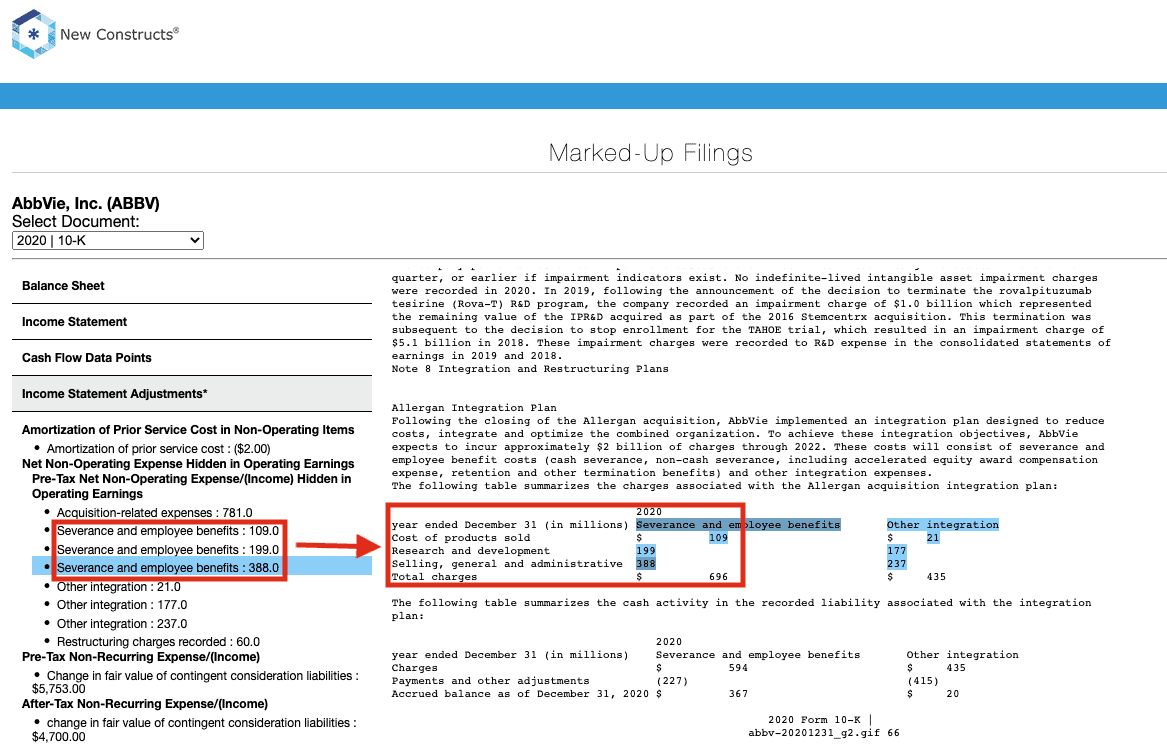
- $696 million in severance and employee benefits – 2020 10-K Page 66
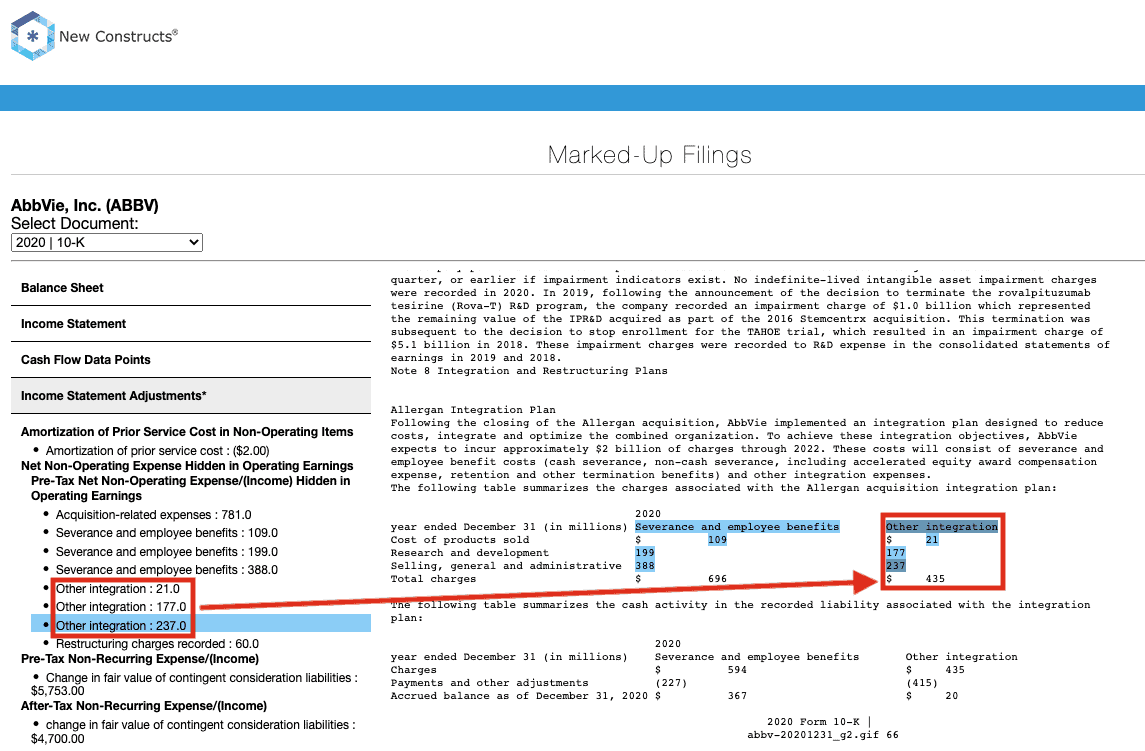
- $435 million in other integration – 2020 10-K Page 66
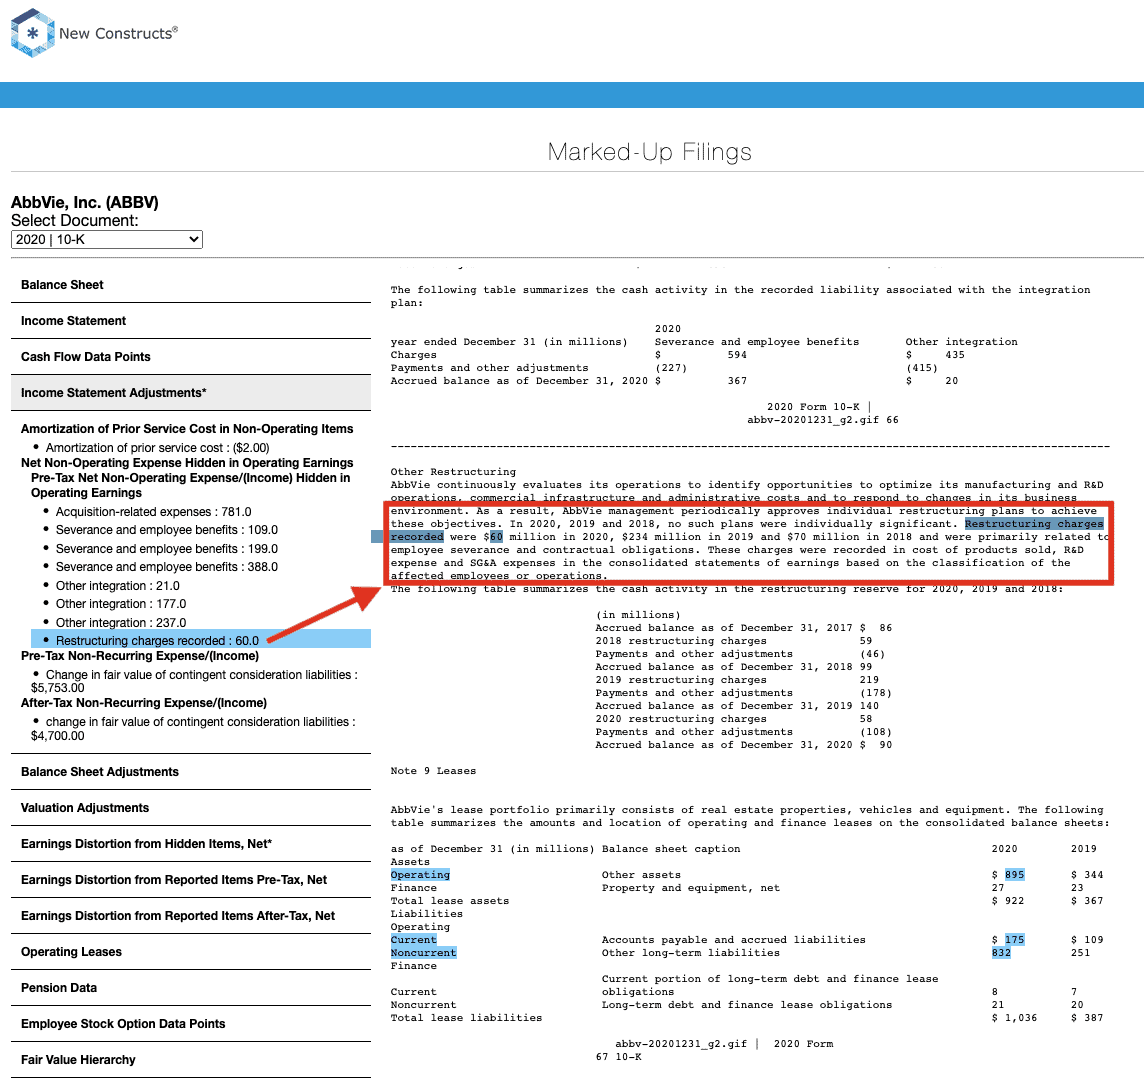
- $60 million in restructuring charges recorded – 2020 10-K Page 67
- $42 million in interest for present value of operating leases
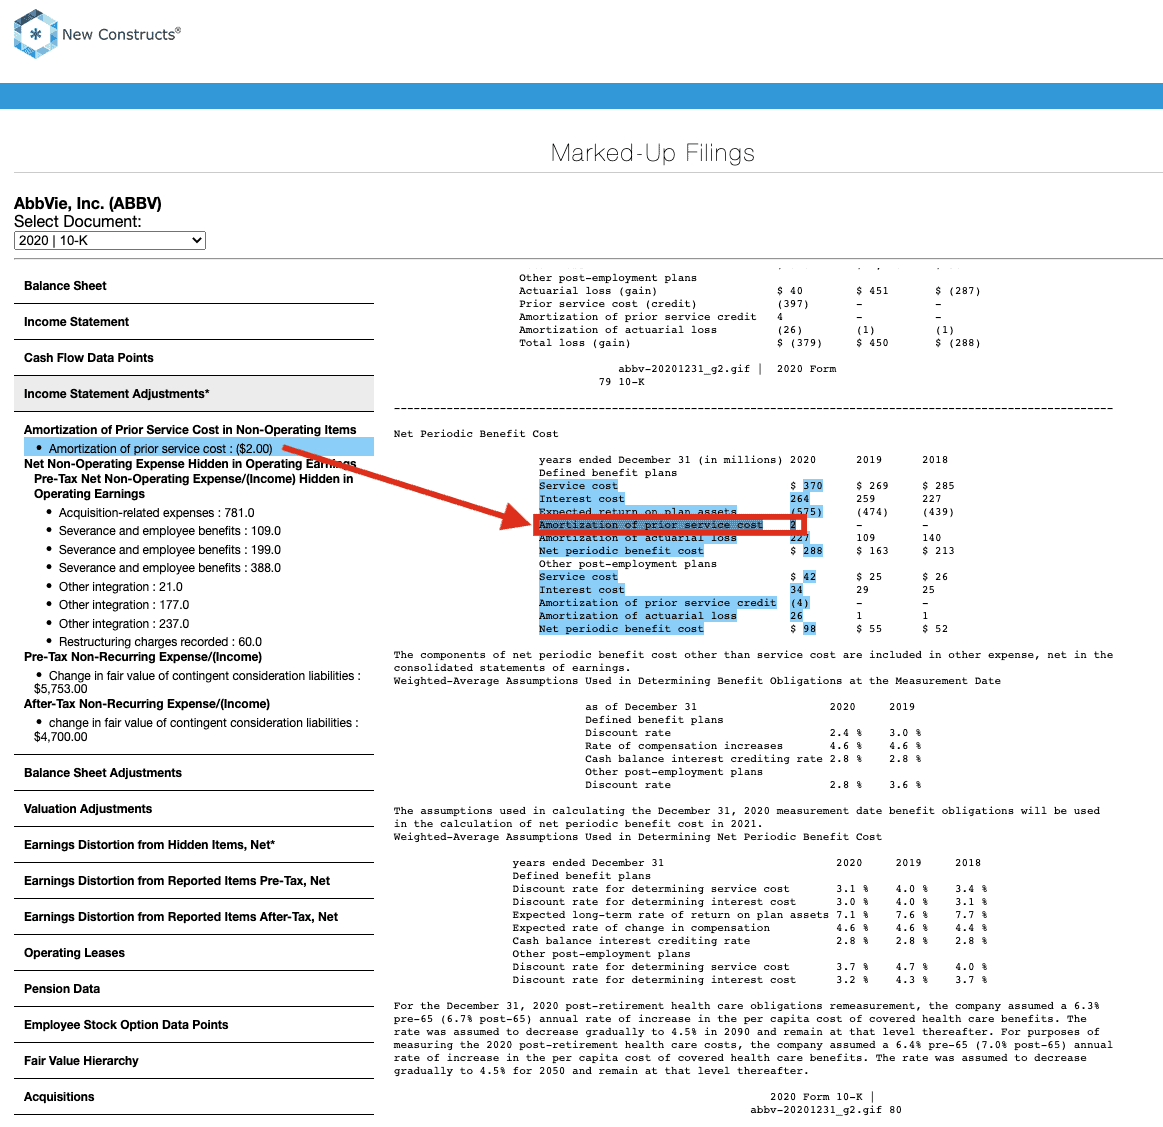
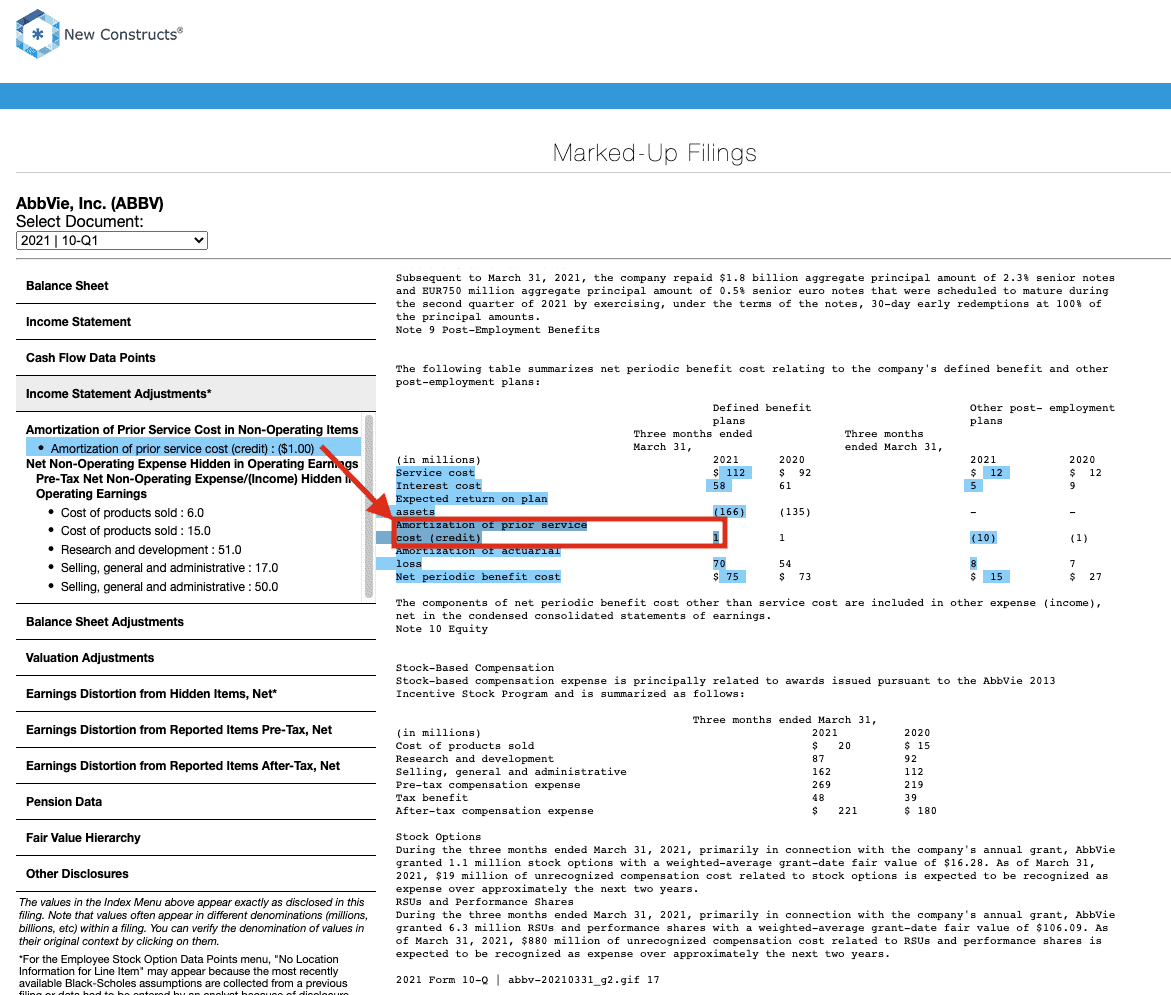
- -$3 million in amortization of prior service cost
- -$2 million in amortization of prior service – 2020 10-K Page 80
- -$1 million in amortization of prior service – 1Q21 10-Q Page 17
- $1.6 billion net non-operating expense hidden in operating earnings
- The difference between change in net working capital and adjusted net working capital is $39.2 billion.
- The difference between change in adjusted fixed assets vs depreciation and amortization - CAPEX - acquisitions is $106.4 billion.
Figure 5 reconciles AbbVie’s True FCF and Traditional FCF and details each of the differences listed above.
Figure 5: AbbVie: True FCF Vs. Traditional FCF Detailed Comparison[8]
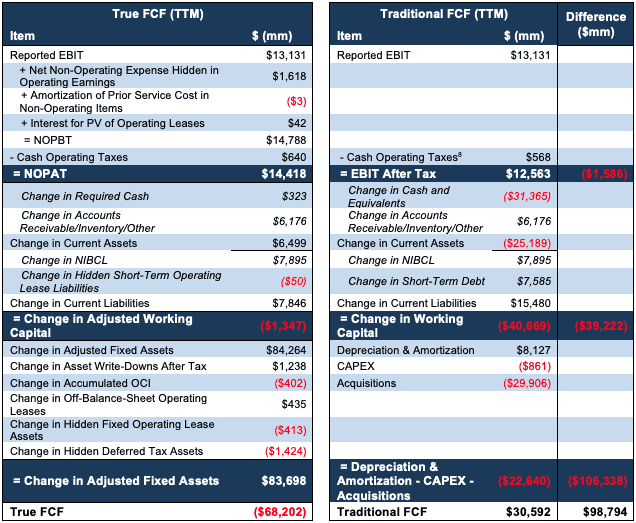
Sources: New Constructs, LLC and company filings.
Ranking the Sectors by Difference in True vs Traditional FCF
Figure 6 ranks 10 of the 11 S&P 500 sectors (excluding Financials) by the dollar value difference between Traditional and True FCF. The Telecom Services sector has the most overstated Traditional FCF (in total dollars), while the Industrials sector has the most understated Traditional FCF. T-Mobile U.S. (TMUS), with FCF overstated by more than $95 billion, is a large contributor to the ~$72 billion difference between Traditional and True FCF in the Telecom Services sector. Southwest Airlines (LUV), Delta Air Lines (DAL), and United Airlines Holdings (UAL) account for a combined $38 billion of the ~$87 billion in understated FCF in the Industrials sector.
Figure 6: TTM True FCF Vs. Traditional FCF by S&P 500 Sector (Excluding Financials)
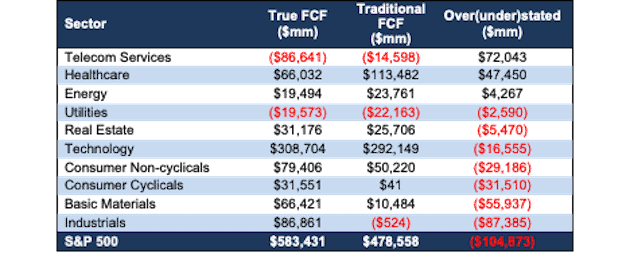
Sources: New Constructs, LLC and company filings.
Get Quarterly Updates on the S&P 500 and Its Sectors
Every quarter, we provide the latest look at FCF and FCF yield for the S&P 500 and each of its sectors. Get the most recent update in S&P 500 & Sectors: Free Cash Flow Yield Through 1Q21.
In addition to FCF, we provide fundamental market and sector trends analysis in S&P 500 & Sectors: Core Earnings Vs. GAAP Net Income Through 1Q21, S&P 500 & Sectors: ROIC vs. WACC Through 1Q21, and S&P 500 & Sectors: Price-to-Economic Book Value Through 1Q21. Additionally, we provide similar analysis of our all cap index, the NC 2000, which can be found here.
This article originally published on June 9, 2021.
Disclosure: David Trainer, Kyle Guske II, Alex Sword, and Matt Shuler receive no compensation to write about any specific stock, style, or theme.
Follow us on Twitter, Facebook, LinkedIn, and StockTwits for real-time alerts on all our research.
Appendix: Calculation Methodology
We derive the metrics above by summing the Trailing Twelve Month individual S&P 500 constituent values for Free Cash Flow in each sector and for the entire S&P 500. We call this approach the “Aggregate” methodology.
The Aggregate methodology provides a straightforward look at the entire sector and index, regardless of market cap or index weighting and matches how S&P Global (SPGI) calculates metrics for the S&P 500.
[1] Only Core Earnings enable investors to overcome the flaws in legacy fundamental data and research, as proven in Core Earnings: New Data & Evidence, a paper in The Journal of Financial Economics written by professors at Harvard Business School (HBS) & MIT Sloan.
[2] Due to a lack of a sufficient number of available filings to calculate a Traditional FCF over the TTM, we exclude Amcor Plc (AMCR), Carrier Global Corp (CARR), and Otis Worldwide Corp (OTIS) from this analysis.
[3] 76 Financials sector companies and non-Financials companies with significant financial operating subsidiaries are excluded from this analysis.
[4] EBIT is net of stock-based compensation.
[5] Change in Adjusted Fixed Assets includes acquisitions.
[6] For 3rd-party reviews, including The Journal of Financial Economics, on our more reliable fundamental data, historically and prospectively, across all stocks, click here and here.
[7] We calculate the Cash Operating Taxes applied to Reported EBIT and NOPBT using the same cash operating tax rate.
[8] We calculate the Cash Operating Taxes applied to Reported EBIT and NOPBT using the same cash operating tax rate.
2 replies to "The Most Overstated & Understated FCF in the S&P 500 Post 1Q21 Earnings"
I have no reason to doubt that your various calculations are correct. I would be less than honest though if I didn’t say I really feel like I need an MBA in business accounting to decipher all the information. My eyeballs glaze over at the various charts you present. It has come to my attention that perhaps someone like me is not your target audience.
Thanks for sharing this broadly, and not requiring a full individual subscription. I always use your summary reports (as provided by my broker) when deciding on an investment change (either adding or deleting), and this article is going to result in a new round of scrutiny of our portfolio.
This kind of in-depth analysis of a company’s financial fundamentals, which you normally summarize into easily-understood bottom-line numbers and color-coded ratings in your individual-stock reports, should be at the core of every investor’s decision making. While Steve is overwhelmed by the detailed description that you provided in this article, he and others should be aware that this level of detail, while available to your readers, does not need to be understood unless they are wanting additional evidence of how you arrived at your bottom-line numbers and ratings. Your summary reports, once the reader has faith in the methodology, are sufficient to provide those key insights. In addition, the stock-by-stock reports (and alerts) of each individual subscriber’s particular portfolio makes your full-subscription service even more useful for those who want to avoid surprises but have limited time to manage their portfolios.