We closed the CBRL position on April 29, 2022. A copy of the associated Position Update report is here.
We closed SPG on November 16, 2021. A copy of the associated Position Update report is here.
This week we’re featuring three stocks from our “See Through the Dip” series that recently reported earnings. Our See Through the Dip reports identified industry-leading firms positioned for even higher profits post COVID-19 than before.
Simon Property Group, Inc. (SPG: $115/share), Omnicom Group, Inc. (OMC: $71/share), and Cracker Barrel Old Country Store, Inc. (CBRL: $152/share) are this week’s Long Ideas.
These “See Through the Dip” Ideas Still Have Room to Run
We leverage more reliable fundamental data, proven in The Journal of Financial Economics[1], with qualitative research to highlight firms whose stocks present excellent risk/reward. Figure 1 shows the performance of the three “See Through the Dip” companies featured in this report.
Figure 1: Long Idea Performance: From Date of Publication Through 2/23/2021
Sources: New Constructs, LLC
*Measured from the date of publication of each respective See Through the Dip report. Dates can be seen in each company section below.
Simon Property Group Still Looks Cheap
We made Simon Property Group a Long Idea in April 2020. At the time, this best-in-class REIT was trading at historically low valuations. Here’s what we learned from 4Q20 earnings and why the stock still provides quality risk/reward.
What’s Working: The long-running narrative of the “Retail Apocalypse”, along with the pandemic-induced disruptions to retailers, led to overly negative expectations for Simon Property Group’s long-term business operations, which are already improving.
While revenue fell 18% from 2019 to 2020, Simon Property Group is already on a path to returning revenue to pre-pandemic levels. As of February 5, 2021, the firm managed to collect 90% of net billed rents from 2Q20 through 4Q20 combined. For comparison, as of November 6, 2020, the firm had only collected 72% of its net billed rents for 2Q20 and 85% for 3Q20.
In our report in April 2020, we also noted that the firm’s liquidity positioned it well, not to just survive the economic impact of the pandemic, but to thrive in a recovery. While other mall operators have been forced into bankruptcy, Simon Property Group’s strong liquidity position allowed the firm to get stronger in a challenging environment.
Simon Property Group expanded its operations by acquiring Taubman Realty Group and partnering with other firms to purchase Forever 21, Lucky Brand, Brooks Brothers, and JCPenney out of bankruptcy.
Simon Property Group’s high quality mall portfolio also bodes well for future growth. The recent trend of people leaving urban areas for suburban locations could create a long-term tailwind for Simon Property Group as malls are more relevant in suburban locations. Additionally, the firm’s attractive locations have led to discussions with Amazon (AMZN) about utilizing empty mall space for Amazon Fulfillment purposes, thereby turning what would have been a drag on revenue into another opportunity.
What’s Not Working: Before the pandemic, Simon Property Group’s vacancy rates were well-below the national average. At the end of 2019, the national mall vacancy rate was 9.7%, which was nearly double Simon Property Group’s vacancy rate of 4.9%. Though the national average mall vacancy rate rose to 10.5% at the end of 2020, Simon Property Group’s vacancy rate of 8.7% rose at an even faster rate, though it remains below the national average.
The large number of brick-and-mortar bankruptcies also leaves fewer potential tenants for Simon Property Group. While the firm has kept a few bankrupt tenants operating, it cannot buy every retailer that becomes insolvent.
With many of its tenants struggling to keep their doors open, Simon Property Group pursued a strategy of providing $400 million worth of rent abatements in 2020 in hopes that the assistance would enable struggling firms to stay afloat and resume paying rent over the long term. If the economic slowdown persists, or more government restrictions are implemented, Simon Property Group could find itself in a position of needing to offer more abatements to its tenants which could delay its own recovery.
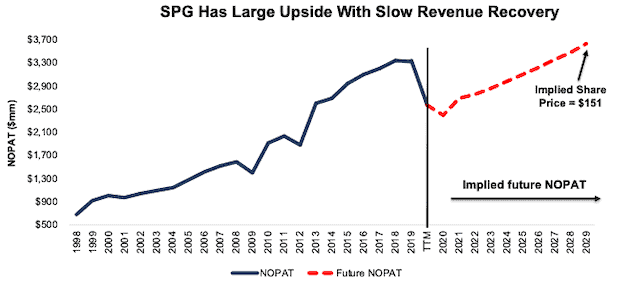
Current Price Leaves Lots of Upside: We use our reverse discounted cash flow (DCF) model to analyze the implied value of the stock based on assumptions about Simon Property Group’s future growth in cash flows.
In this scenario, we assume:
- Simon Property Group maintains its current NOPAT margin of 52% in 2020 and improves to 58% (five-year average) in 2021 and each year thereafter
- Revenue grows at 1% in 2021 and 3% in 2022 (equal to consensus estimates)
- Revenue grows at 4% thereafter, which is equal to Simon’s 10-year revenue CAGR.
In this scenario, Simon Property Group’s net operating profit after-tax (NOPAT) grows by less than 1% compounded annually over the next decade and the stock is worth $151/share today – a 31% upside to the current price. See the math behind this reverse DCF scenario. In this scenario, Simon Property Group’s revenue doesn’t reach pre-pandemic levels until 2027 and its revenue in 2030 is only 8% above its pre-pandemic 2019 revenue. Should an economic recovery happen sooner (as many expect), SPG would be worth even more.
Figure 2: Simon Property Group’s Historical and Implied NOPAT
Sources: New Constructs, LLC and company filings
Omnicom Group Provides Quality Risk/Reward
We first made Omnicom a Long Idea in May 2018 and included it in our “See Through the Dip” thesis in May 2020. Here’s what we learned from 4Q20 earnings and why OMC remains an open Long Idea.
What’s Working: While many investors anticipated a decline in Omnicom’s advertising business due to the economic slowdown in 2020, expectations for Omnicom’s future cash flows got too negative.
Omnicom’s 4Q20 earnings release highlights why we included it in our “See Through the Dip” thesis. The firm’s flexible cost structure allowed it to restructure its business in 2020 and realign costs to match a lower revenue environment. Despite declining revenue, the firm maintained profitability and generated $1.8 billion (12% of its market cap) in free cash flow (FCF) in 2020.
Better yet, Omnicom is already seeing signs of a recovery, witnessed by quarter-over-quarter revenue growth in 3Q20 and 4Q20. For further reference, the firm’s revenue fell 24% year-over-year (YoY) in 2Q20 but just 9% YoY in 4Q20. The persistence of Omnicom’s business and its deep client relationships clients provide growth opportunities as the economy recovers.
While the firm’s revenue was down in 2020, it wasn’t all bad news. The firm’s revenue from the Technology and Government industries rose by 9% and 11%, respectively. Omnicom was also able to make additions to its client list. Some of the additions to its portfolio in 2020 include Clorox’s (CLX) U.S. media business, Home Depot’s (HD) media business, and all brand and product advertising for State Farm.
What’s Not Working: As businesses everywhere looked to reduce costs and conserve cash, many advertising budgets got slashed throughout 2020. Lower advertising budgets took their toll on Omnicom’s revenue, which fell 12% YoY, the worst YoY decline since the Great Recession in 2008.
In particular, Omnicom’s revenue fell in each of the Travel & Entertainment, Oil, Gas & Utilities, and Not-for-profit industries by 22% or more in 2020. We expect each of these industries to recover to pre-pandemic levels eventually, but such recovery is likely to take longer than other industries. In other words, the firms in these industries may be less willing to up their advertising budgets anytime soon, which puts a limit on Omnicom’s revenue growth potential in the short term.
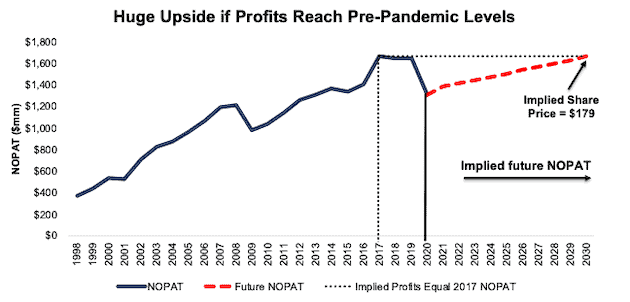
Current Price Leaves Lots of Upside: Below we use our reverse DCF model to analyze the implied value of the stock based on different assumptions about Omnicom’s future growth in cash flows.
In this scenario, we assume:
- Omnicom’s NOPAT margin remains at the 2020 level of 9.9% (vs. five-year average of 10.2%)
- Revenue grows by 3% compounded annually from 2021 to 2023 (equal to consensus estimates)
- Revenue grows at 2% each year thereafter, which is below the average annual global GDP growth rate since 1961.
In this scenario, Omnicom’s NOPAT grows by 3% compounded annually over the next 10 years and the stock is worth $179/share today – a 152% upside to the current price. See the math behind this reverse DCF scenario. In this scenario, Omnicom’s NOPAT in 2030 matches its 2017 NOPAT. If Omnicom’s NOPAT recovers sooner, its stock has even more upside. For reference, PWC’s Global Entertainment & Media Outlook expects the Advertising sector to exceed 2019 levels in 2022.
Figure 3: Omnicom’s Historical and Implied NOPAT
Sources: New Constructs, LLC and company filings
Cracker Barrel Old Country Store Still Provides Value
We made Cracker Barrel a Long Idea in June 2019 and featured it as a “See Through the Dip” pick in April 2020. Though the stock has rallied from lows of $57/share in late March 2020, it still offers plenty of upside in the ongoing recovery. Here’s what we learned from the earnings report and why we still like this stock even after reporting a difficult fiscal 2Q21.
What’s Working: The restaurant industry has been one of the most negatively impacted industries throughout the pandemic. However, investors failed to account for Cracker Barrel’s competitive advantages, which have enabled it to improve its competitive position in very difficult market conditions.
While several restaurant chains filed for bankruptcy in 2020, Cracker Barrel gained significant market share despite its own YoY decline in revenue. Cracker Barrel’s share of the U.S. chain restaurant market improved from 1.8% in fiscal 2Q20 to 2.1% in fiscal 2Q21.
One of the leading drivers of its increased market share is the vast improvement in the firm’s off-premise business. In fiscal 2Q21, off-premise dining grew 78% YoY and accounted for 30% of all restaurant sales. Once its physical locations return to 100% capacity, Cracker Barrel’s restaurant sales could exceed pre-COVID levels as an expanded off-premise business combines with a restored on-premise business.
What’s Not Working: Industry wide, the recovery of restaurant capacity is slower than we first expected. Increased lockdown mandates as a result of a resurgence of COVID-19 cases in fiscal 2Q21 (from October 31, 2020 to January 29, 2021) led to even more difficult operating conditions than in fiscal 1Q21. Comparable store sales decreased 22% in fiscal 2Q21 over the prior quarter and 15% over the prior year.
With many of Cracker Barrel’s locations catering to travelers on major highways, recovery in the firm’s on-premise business is closely tied to domestic tourism. While domestic tourism is likely to recover sooner, McKinsey projects the U.S. tourism market will not fully recover until 2024. In other words, Cracker Barrel may have to wait a while longer before it sees a full recovery in its on-premise sales. Despite the more prolonged recovery, CBRL still holds significant upside, as we’ll show below.
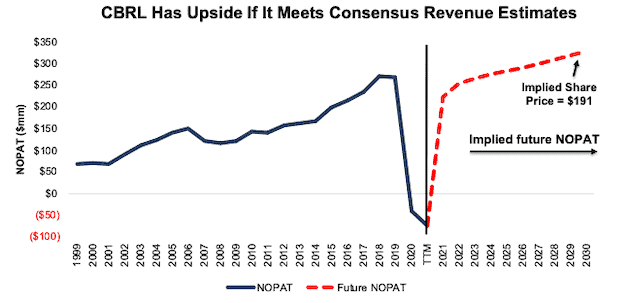
Current Price Leaves Lots of Upside: Below we use our reverse DCF model to analyze the implied value of the stock based on different assumptions about Cracker Barrel’s future growth in cash flows.
In this scenario, we assume:
- Cracker Barrel’s NOPAT margin improves to 8% (average from 2016-2019 vs. -3% TTM)
- Revenue grows by 8% in 2021, 14% in 2022, and 4% in 2023 (in line with consensus estimates)
- Revenue grows at 3% compounded annually thereafter, which is below the average global GDP growth rate of 3.5% since 1961.
In this scenario, Cracker Barrel’s revenue grows by just 5% compounded annually over the next decade and the stock is worth $191/share today – a 26% upside to the current price. See the math behind this reverse DCF scenario. In this scenario, Cracker Barrel’s NOPAT would grow just 2% compounded annually from 2019-2030. For reference, Cracker Barrel’s NOPAT grew 8% compounded annually in the preceding 11 years (2008-2019).
Figure 4 Cracker Barrel Historical and Implied NOPAT
Sources: New Constructs, LLC and company filings
The Real Earnings Season Is Now Here
While the traditional quarterly earnings season may be winding down, the real earnings season – 10-K filing season – is just getting started. Traditional earnings measures are subject to accounting loopholes and are off by an average of ~20%. Investors deserve more reliable fundamental data that rigorously analyzes the footnotes and MD&A. Our Core Earnings give investors a more reliable picture of a firm’s profitability, and in turn valuation, by removing all the unusual items that distort GAAP net income and data from other providers and helps find quality Long Ideas like Simon Property Group, Omnicom, and Cracker Barrel above.
This article originally published on February 24, 2021.
Disclosure: David Trainer owns SPG. David Trainer, Kyle Guske II, and Matt Shuler receive no compensation to write about any specific stock, sector, style, or theme.
Follow us on Twitter, Facebook, LinkedIn, and StockTwits for real-time alerts on all our research.
[1] Our reports utilize our Core Earnings, a more reliable measure of profits, as demonstrated in Core Earnings: New Data & Evidence, a paper by professors at Harvard Business School (HBS) & MIT Sloan. Recently accepted by the Journal of Financial Economics, the paper proves that our data is superior to all the metrics offered elsewhere.


