
We closed this position on June 29, 2022. A copy of the associated Position Update report is here.
We published an update on this Danger Zone pick on August 9, 2021. A copy of the associated Earnings Update report is here.
Check out this week’s Danger Zone interview with Chuck Jaffe of Money Life.
Investors love a technology stock that shows promising revenue growth in a rapidly growing industry. Picking stocks in this sector is easier, as it’s the only sector with positive and growing economic earnings. However, not all stocks in the sector are created equal.
This firm has achieved the hyper revenue growth investors love, but profits remain elusive. Now, as the market matures and competition firmly establishes itself, this firm’s lack of resources and highly negative margins create an uphill battle. Compounding these challenges, the firm’s executive compensation plan misaligns executives’ interests. These issues make this stock’s lofty valuation appear out of touch with reality, and Zendesk Inc. (ZEN: $43/share) is this week’s Danger Zone pick.
Strong Revenue Growth Has Led to Growing Losses
Since 2014, ZEN’s revenue has grown an impressive 50% compounded annually. At the same time, its after-tax profit (NOPAT) has from -$64 million to -$110 million, per Figure 1. The decline in NOPAT stems from highly negative NOPAT margins, which were -26% in 2017. The company’s return on invested capital (ROIC) is currently a bottom-quintile -28%.
Figure 1: ZEN’s Revenue & NOPAT Since 2014
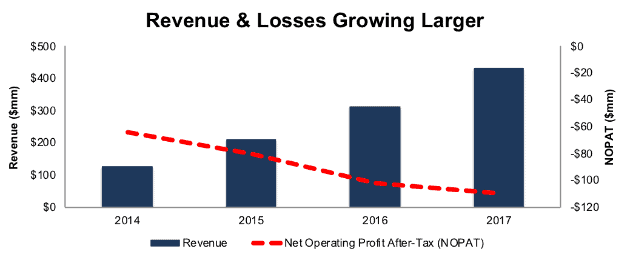
Sources: New Constructs, LLC and company filings
Focus on Non-GAAP Metrics Hides Growing Losses
While true profits are falling, ZEN would rather investors focus on non-GAAP metrics. These metrics, such as non-GAAP gross profit, non-GAAP gross margin, non-GAAP operating margin, and non-GAAP net income paint a wildly different picture of the firm’s profits. Our research enables clients to see through these misleading financial metrics. Below are some of the items Zendesk removes for its non-GAAP net income:
- Share-based compensation
- Amortization of share-based compensation
- Employer tax related to employee stock transactions
- Acquisition related expenses
In 2016, ZEN removed nearly $73 million (24% of revenue) in share-based compensation expense to calculate non-GAAP net income. In 2017, ZEN removed over $85 million (20% of revenue) in share-based compensation expense.
ZEN reported 2017 non-GAAP net income of -$13 million. Per Figure 2, GAAP net income and economic earnings, the true cash flows of the business, were -$111 million and -$142 million respectively.
Long-term, non-GAAP net income has improved from -$32 million in 2014 to -$13 million while economic earnings have fallen from -$77 million in 2014 to -$142 million.
Figure 2: ZEN’s Non-GAAP Metrics Paint False Picture of Performance
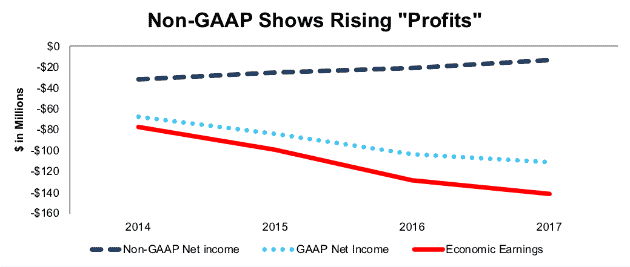
Sources: New Constructs, LLC and company filings
Compensation Plan Rewards Execs for Non-GAAP Growth, Not Creating Shareholder Value
Zendesk’s executive compensation misaligns executives’ interests with shareholders’ interests. The misalignment helps drive the profit decline shown in Figure 1 and the disconnect between non-GAAP net income and economic earnings.
Executives’ annual bonuses are performance based and awarded on the achievement of “corporate performance objectives’ and “operational objectives.” Corporate performance objectives include net recurring revenue and non-GAAP operating margin goals. Share-based compensation is once again removed from non-GAAP operating margin, even though ZEN acknowledges it is used to attract and retain employees (similar to a salary, a standard operating expense).
Long-term incentives are provided in the form of stock options and restricted stock units, neither of which have a performance-based component. Instead, long-term incentives vest over a three-year period and incentivize executives to increase share price, no matter the long-term impact on the economics of the business.
The bottom line is that executives are incentivized by metrics that have allowed execs to earn bonus awards while destroying shareholder value. We’ve demonstrated through numerous case studies that ROIC, not non-GAAP net income or similar metrics, is the primary driver of shareholder value creation. A recent white paper published by Ernst & Young also validates the importance of ROIC (see here: Getting ROIC Right) and the superiority of our data analytics. Without major changes to this compensation plan (e.g. emphasizing ROIC), investors should expect further value destruction.
Negative Margins Make Competitive Industry More Difficult
Zendesk may be best known for delivering customer support, chat, and phone services, otherwise known as customer engagement. However, it is not the only firm providing these services, as the industry has relatively low barriers to entry and is already filled with competition, both large and small. Top competitors include salesforce (CRM), Oracle (ORCL), and Microsoft (MSFT) all of which rank above ZEN in Gartner’s 2017 Magic Quadrant for Customer Engagement Center. Apart from large tech firms, Zendesk faces many smaller competitors such as LiveAgent, TeamSupport, ZohoDesk, FreshWorks, HappyFox, or Help Scout, to name a few.
At its core, Zendesk offers customer support management, which in today’s Internet of Things and “always connected” world, is not a service that has a significant competitive moat. Support ticket tracking, chat software, phone call integration, and third-party app support are all services offered by Zendesk and its top competitors. With such low barriers to entry, Zendesk and its competition are forced to compete on price, scalability, and reliability, more so than technological advancements.
Zendesk’s margins and ROIC, which rank well below its largest competition, are a disadvantage in this intensely competitive landscape. With highly negative margins, Zendesk cannot compete on price or generate the capital needed to continually improve and market its products against stalwart competition.
Figure 3: Zendesk’s NOPAT Margin Ranks at the Bottom
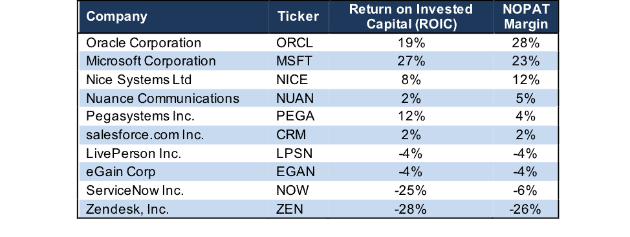
Sources: New Constructs, LLC and company filings
Bull Case Dreams of “Scale” and Ignores Lack of Capital
Zendesk has certainly focused on revenue growth, at the expense of profits, as shown above. However, in order to buy into the bull case, investors must ignore that the hyper growth has not achieved the large economies of scale and competitive strength needed to survive over the long-term.
Since 2014, ZEN has more than doubled the number of paid customer accounts using its products, to 119,000. However, every quarter since 1Q14, ZEN’s operating expenses have been larger than overall revenue. The average revenue per account in 2017 equaled $3,600 while average operating expenses per account totaled $4,600. Since 2015, the firm’s revenue has grown 43% compounded annually with operating expenses close behind at 37% compounded annually. In total, operating expenses made up 127% of revenue in 2017.
Beyond cost concerns, Zendesk lacks the capital and the operational flexibility to grow at such high rates and complete longer-term. Per Figure 4, Zendesk is one of only two competitors with no excess cash and has the second highest cash burn of competitors listed. Based on cash on the books in 2017, ZEN can only sustain its current cash burn for a little over a year before needing a dilutive influx of capital.
Figure 4: Zendesk’s Capital Resources Create Long-Term Struggle
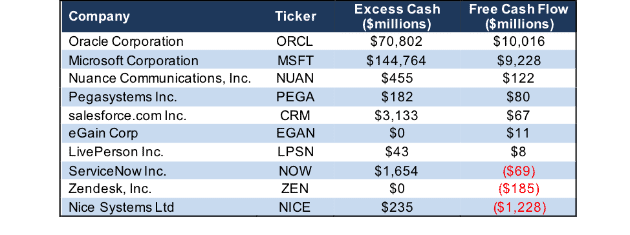
Sources: New Constructs, LLC and company filings
The ability to invest capital into product development and sales & marketing is key in a highly commoditized customer engagement market. Oracle, Microsoft, and salesforce combined spent over $29 billion in sales & marketing expenses, or nearly 7 times ZEN’s market cap, over the prior twelve-month period. These firms also spent nearly $22 billion in research & development, or five times ZEN’s market cap. Without another product/service to build a moat around, ZEN is left fighting the giants in the industry with far less capital and negative margins.
ZEN also brings narrower product breadth to battle with larger, more profitable competitors. Salesforce provides other cloud-based products that integrate with software vendors. It also provides exclusive app extensions via the platform’s AppExchange. Microsoft’s Dynamics 365 integrates with Microsoft Office while Oracle’s Service Cloud integrates with its other cloud offerings such as supply chain management or enterprise resource planning. ZEN lacks comparable cloud offerings, and, therefore, brings a weaker value proposition to customers.
Even if you believe that ZEN can quickly cut expenses while maintaining high revenue growth, such optimism (and more) is already reflected in the stock price. ZEN’s current valuation implies that it will immediately improve margins and grow revenues to levels far beyond the current size of the entire customer engagement market, as shown below.
ZEN’s Valuation is Priced for Absolute Perfection
ZEN shares have benefited greatly from the rise in tech stocks, and in particular, those involved with customer engagement. ZEN is up 111% over the past two years while the S&P is up just 39%. This outperformance comes despite the firm’s cash losses widening and more competition entering the market. Just this year, ZEN is up 24%, and the price appreciation has pushed it to a level where the expectations baked into the stock price are disconnected from reality.
To justify its current price of $43/share, ZEN must immediately improve NOPAT margins to 2% (equal to salesforce’s margin, compared to -26% in FYE 2017) and grow revenue by 28% compounded annually for the next 20 years. In this scenario, ZEN would be generating over $61 billion in revenue (20 years from now). For reference, ZEN CEO Mikkel Svane noted in the company’s 3Q17 earnings call that the market spends “$12 billion annually on ZEN’s sector.” Essentially, ZEN’s current valuation implies it will grow revenue to more than five times the size of the current market while also drastically improving its profit margins.
Even in a highly optimistic scenario, ZEN holds significant downside risk. If we assume ZEN achieves a 12% NOPAT margin (average of competitors with positive margins in Figure 3) and grows revenue by 19% compounded annually for the next decade, the stock is worth only $25/share today – a 42% downside.
Each of these scenarios also assumes ZEN is able to grow revenue, NOPAT and FCF without increasing working capital or fixed assets. This assumption is unlikely but allows us to create best-case scenarios that demonstrate how high expectations embedded in the current valuation are. For reference, ZEN’s invested capital has grown on average $86 million (20% of 2017 revenue) over the past three years.
Is ZEN Worth Acquiring?
Often the largest risk to any bear thesis is what we call “stupid money risk”, which means an acquirer comes in and pays for ZEN at the current, or higher, share price despite the stock being overvalued. An acquisition could come from an established firm in the customer engagement industry or even another tech giant looking to enter the market quickly. However, as other large tech firms have made acquisitions in recent years, thereby leaving ZEN alone, an acquisition may be less likely now than in the past. Any firm looking to acquire ZEN would be better suited to continue building out their own services rather than imprudently allocating capital and destroying substantial shareholder value in an acquisition.
We show below how expensive ZEN remains even after assuming an acquirer can achieve significant synergies.
Walking Through the Acquisition Value Math
To begin, Zendesk has liabilities of which investors may not be aware that make it more expensive than the accounting numbers suggest.
- $171 million in outstanding employee stock options (4% of market cap)
- $96 million in off-balance-sheet operating leases (2% of market cap)
After adjusting for these liabilities, we can model multiple purchase price scenarios. Even in the most optimistic of scenarios, ZEN is worth less than its current share price.
Figures 5 and 6 show what we think International Business Machines (IBM) should pay for ZEN to ensure it does not destroy shareholder value. While purely hypothetical, acquiring ZEN would immediately build on its existing Watson Customer Engagement platform while quickly increasing its market presence in the small to medium sized business market. However, there are limits on how much IBM would pay for ZEN to earn a proper return, given the NOPAT or free cash flows (or lack thereof) being acquired.
Each implied price is based on a ‘goal ROIC’ assuming different levels of revenue growth. In both scenarios, the estimated revenue growth rate is 31% in year one and 28% in year two, which is the consensus estimate for ZEN’s revenue growth. For the subsequent years, we use 28% in scenario one because it represents a continuation of consensus estimates. We use 35% in scenario two because it assumes a merger with IBM would create additional revenue opportunities through increased distribution and larger sales force.
We conservatively assume that IBM can grow ZEN’s revenue and NOPAT without spending anything on working capital or fixed assets beyond the original purchase price. We also assume ZEN immediately achieves a 12% NOPAT margin, which is the average of competitors in Figure 3 with a positive margin, and just below IBM’s 15% margin. For reference, ZEN’s 2017 NOPAT margin is -26%, so this assumption implies immediate improvement and allows the creation of a truly best-case scenario.
Figure 5: Implied Acquisition Prices for IBM to Achieve 5% ROIC
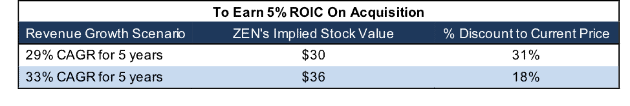
Sources: New Constructs, LLC and company filings.
Figure 5 shows the ‘goal ROIC’ for IBM as its weighted average cost of capital (WACC) or 5%. Even if ZEN can grow revenue by 33% compounded annually, with a 12% NOPAT margin for the next five years, the firm is worth less than its current price of $43/share. It’s worth noting that any deal that only achieves a 5% ROIC would only be value neutral and not accretive, as the return on the deal would equal IBM’s WACC.
Figure 6: Implied Acquisition Prices for IBM to Achieve 10% ROIC
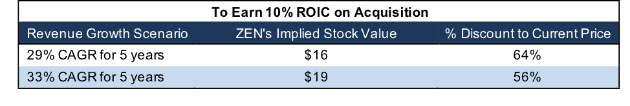
Sources: New Constructs, LLC and company filings.
Figure 6 shows the next ‘goal ROIC’ of 10%, which is IBM’s current ROIC. Acquisitions completed at these prices would be truly accretive to IBM shareholders. Even in the best-case growth scenario, the most IBM should pay for ZEN is $19/share (56% downside to current valuation). Even assuming this best-case scenario, IBM would destroy over $2.7 billion by purchasing ZEN at its current valuation. Any scenario assuming less than 33% compound annual growth in revenue would result in further capital destruction for IBM.
Executive Turnover or Dilutive Capital Raise Could Send Shares Lower
Zendesk’s senior vice president of worldwide sales resigned from the firm in December 2016. Only eight months later, the firm’s chief revenue officer resigned as well. In this case, the executive had only been with the firm for 16 months, and the stock dropped 9% the day the resignation was announced. Any future upheaval in executive positions at Zendesk would further undermine confidence in management and drop shares once again.
Regardless of stability in the c-suite, Zendesk’s cash burn represents a potentially negative catalyst. As noted earlier, Zendesk’s cash on the books in 2017 can only support the firm’s cash burn for just over one year. If cash burn continues at such a rapid pace, investors shouldn’t be surprised if they get diluted by the need to raise additional capital soon. Making matters worse, ZEN’s -$185 million in FCF in 2017 is slightly above the 3-year average of -$183 million. At a time when ZEN needs to continually invest in its products, its resources are dwindling.
While we don’t attempt to predict exactly when the market will recognize the disconnect between expectations and reality, such a realization could severely damage investors’ portfolios.
Insider Trading and Short Interest Are Minimal
Over the past 12 months, five thousand insider shares have been purchased and 732 thousand have been sold for a net effect of 727 thousand insider shares sold. These purchases represent less than 1% of shares outstanding.
Short interest is currently 3.4 million shares, which equates to 3% of shares outstanding and two days to cover. Short interest rose 3% over the prior month but remains down 3% from its 52-week high. Short interest could rise if execution issues hinder revenue growth or a dilutive capital raise is announced.
Auditable Impact of Footnotes & Forensic Accounting Adjustments[1]
Our Robo-Analyst technology enables us to perform forensic accounting with scale and provide the research needed to fulfill fiduciary duties. In order to derive the true recurring cash flows, an accurate invested capital, and an accurate shareholder value, we made the following adjustments to Zendesk’s 2017 10-K:
Income Statement: we made $9 million of adjustments, with a net effect of removing $1 million in non-operating expense (<1% of revenue). We removed $4 million in non-operating income and $5 million in non-operating expenses. You can see all the adjustments made to ZEN’s income statement here.
Balance Sheet: we made $133 million of adjustments to calculate invested capital with a net increase of $64 million. One of the largest adjustments was $96 million in operating leases. This adjustment represented 29% of reported net assets. You can see all the adjustments made to ZEN’s balance sheet here.
Valuation: we made $267 million of adjustments with a net effect of decreasing shareholder value by $267 million. There were no adjustments that increased shareholder value. The largest adjustment to shareholder value was $171 million in outstanding employee stock options. This adjustment represents 4% of ZEN’s market cap.
Unattractive Funds That Hold ZEN
The following funds receive our Unattractive-or-worse rating and allocate significantly to Zendesk Inc.
- Wasatch Small Cap Growth Fund (WIAEX) – 1.9% allocation and Very Unattractive rating
- Westcore Small Cap Growth Fund (WISGX) – 1.9% allocation and Unattractive rating
This article originally published on March 5, 2018.
Disclosure: David Trainer, Kyle Guske II, and Sam McBride receive no compensation to write about any specific stock, style, or theme.
Follow us on Twitter, Facebook, LinkedIn, and StockTwits for real-time alerts on all our research.
[1] Ernst & Young’s recent white paper, “Getting ROIC Right”, proves the superiority of our research and analytics.
Click here to download a PDF of this report.
Photo Credit:プらチナ (Flickr)