
We closed this position on May 17, 2022. A copy of the associated Position Update report is here.
Check out this week’s Danger Zone interview with Chuck Jaffe of Money Life.
The Small Cap Growth style is the worst rated investment style per our 4Q19 Style Ratings for ETFs and Mutual Funds report. Given the low rating of the overall style, it makes sense there would be some particularly bad Small Cap Growth mutual funds in our coverage universe. Our Predictive Risk/Reward Fund ratings, based on the proprietary stock research featured in recent Harvard Business School and MIT Sloan research, reveal a fund that stands out as the worst of the worst.
Despite its 3 Star Morningstar rating, Dunham Small Cap Growth Fund (DADGX and other share classes) is the worst rated fund in our 8,050+ ETF and mutual fund coverage universe. DADGX is in the Danger Zone.
Backwards Looking Research Overrates this Fund
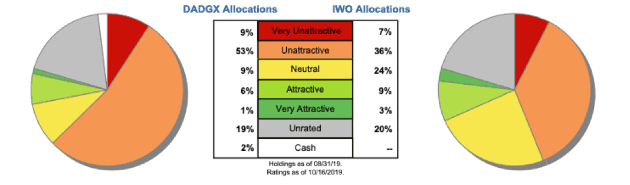
Per Figure 1, DADGX, DCDGX, and DNDGX earn the 3-Star rating from Morningstar. However, our Predictive Risk/Reward Fund Rating methodology shows them as Very Unattractive.
Figure 1: Dunham Small Cap Growth Fund Ratings

Sources: New Constructs, LLC, company, ETF and mutual fund filings, and Morningstar
DADGX allocates significant capital to companies with low profitability and high profit growth expectations baked into their stock prices, which makes its portfolio unusually risky. Investors that rely solely on past performance may not see the true risk of investing in this fund.
Holdings Research Reveals a Low-Quality Portfolio Versus the Benchmark
The only justification for a mutual fund to charge higher fees than its ETF benchmark is “active” management that leads to out-performance. A fund is most likely to outperform if it has higher quality holdings than its benchmark. To assess holdings quality, we leverage our Robo-Analyst technology[1] and “novel dataset” featured in the Harvard Business School and MIT Sloan paper, Core Earnings: New Data and Evidence, to drill down and analyze the individual stocks in every fund we cover.
Figure 2: DADGX Allocates Capital to More Low-Quality Holdings
Sources: New Constructs, LLC and company, ETF and mutual fund filings
Per Figure 2, Dunham Small Cap Growth Fund’s asset allocation poses greater downside risk and holds less upside potential than its benchmark, the iShares Russell 2000 Growth ETF (IWO).
DADGX allocates just 7% of its portfolio to Attractive-or-better rated stocks compared to 12% for IWO. On the flip side, DADGX’s exposure to Unattractive-or-worse rated stocks is much higher, at 62%, than IWO, at 43%. See Figure 3.
Figure 3: DADGX vs. IWO – Attractive & Unattractive Asset Allocation
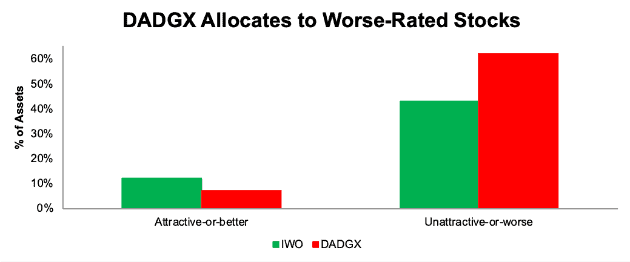
Sources: New Constructs, LLC and company, ETF and mutual fund filings
Given the unfavorable allocation of Very Attractive vs. Very Unattractive stocks relative to the benchmark, DADGX appears poorly positioned to generate the outperformance required to justify its fees.
Poor Stock Selection Process
The sub-advisor for Dunham Small Cap Growth Fund, Pier Capital, notes its investment approach allows it to “invest in companies where Wall Street is underestimating growth and avoid investing in those where they are overestimating growth.”
However, when we look at DADGX’s holdings, we find that it allocates to stocks with significantly higher expectations for future profit growth than its benchmark and the market as a whole.
Figure 4 contains our detailed rating for DADGX, which includes each of the criteria we use to rate all funds under coverage. These criteria are the same for our Stock Rating Methodology because the performance of a fund’s holdings equals the performance of a fund after fees.
Figure 4: Dunham Small Cap Growth Fund Rating Breakdown
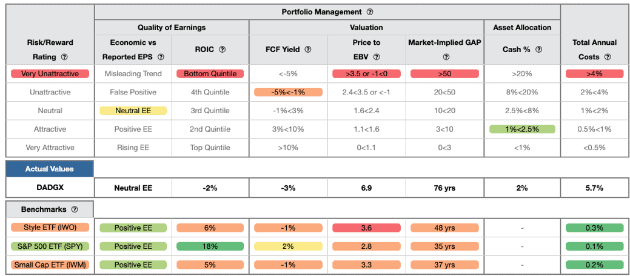
Sources: New Constructs, LLC and company, ETF and mutual fund filings
As Figure 4 shows, DADGX’s holdings are inferior to its benchmark, IWO, in all five of criteria that make up our holdings analysis. Specifically:
- DADGX’s return on invested capital (ROIC) is -2% and well below the 6% earned by IWO and 18% by the S&P 500 (SPY).
- DADGX’s free cash flow yield of -3% is worse than the -1% of IWO and 2% of SPY.
- The price to economic book value (PEBV) ratio for DADGX is 6.9, which is significantly greater than the 3.6 for IWO holdings and the 2.8 of SPY holdings.
- Our discounted cash flow analysis reveals an average market implied growth appreciation period (GAP) of 76 years for DADGX’s holdings compared to 48 years for IWO and 35 years for SPY.
The stocks held by DADGX generate inferior cash flows compared to IWO, yet the market expects stocks held by DADGX to grow profits by nearly double that of IWO stocks. Lower historical profits and higher expectations for future profits do not make a good combination.
DADGX Strays From its Stated Methodology
Despite being a Small Cap Growth fund, DADGX holds nearly 40 stocks (out of ~106) with market caps well above the traditional $2 billion small cap designation. Some of these stocks are clearly large cap stocks, such as ServiceNow (NOW: $48 billion market cap), Atlassian Corporation (TEAM: $30 billion market cap), and Spotify (SPOT: $21 billion valuation). This style drift means investors expecting small cap exposure aren’t getting what they’re promised.
Methodology Leads to Bad Stock Picks
Apart from allocating to numerous large and mid cap stocks, DADGX also allocates to some of the most overvalued small cap stocks. DADGX’s holdings include many previous Danger Zone picks and stocks with notable flaws in their business model that we’ve singled out, including Installed Building Products (IBP), ServiceNow (NOW), Zendesk (ZEN), LivePerson (LPSN), Spotify (SPOT), The RealReal (REAL), PROS Holdings (PRO), Chewy Inc. (CHWY), 8x8 Inc. (EHGT), and Avalara (AVLR).
Cubic Corporation (CUB: $73/share) is one of the worst of DADGX’s holdings. Since 2012, CUB’s economic earnings have fallen from $65 million to -$78 million TTM.
Figure 5: CUB’s Economic Earnings Decline Since 2012
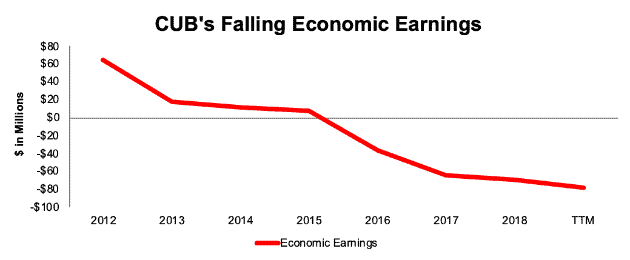
Sources: New Constructs, LLC and company filings
Economic earnings account for non-operating expenses and income, such as the $33 million (3% of TTM revenue) gain on sale disclosed in CUB’s 3Q 10-Q. Only by adjusting for these non-operating items can we calculate the true operating profits of the business.
Economic earnings also account for changes to the balance sheet, and include items such as operating leases hidden (not for long) off the balance sheet. CUB’s invested capital has more than doubled since 2012 despite its revenue remaining flat. Growth in invested capital without subsequent revenue growth drove CUB’s invested capital turns (a measure of balance sheet efficiency) down from 2.6 in 2012 to 0.9 TTM.
Falling invested capital turns, combined with declining NOPAT margins (down from 7% in 2012 to 2% TTM) drove CUB’s ROIC from a once impressive 18% in 2012 to a bottom quintile 2% TTM.
CUB is Significantly Overvalued
Despite the deterioration in the true profits of the company, shares have increased ~80% since early 2012 and are drastically overvalued. We use our reverse DCF model to quantify the growth in cash flows CUB must achieve to justify its valuation.
To justify its current price of $73/share, CUB must immediately achieve 7% NOPAT margins (the highest the company ever achieved in 2012 – compared to 2% TTM) and also grow NOPAT by 18% compounded annually for the next 17 years. See the math behind this reverse DCF scenario. This expectation seems rather optimistic given that CUB’s NOPAT has fallen by 25% compounded annually since 2012.
Even if we assume CUB can achieve 5% NOPAT margins, and grow NOPAT by 23% compounded annually for the next decade, the stock is worth only $37/share today – a 49% downside. See the math behind this reverse DCF scenario.
Excessive Fees Make Outperformance Even More Difficult
At 5.71%, DADGX’s total annual costs (TAC) are the highest out of the 536 Small Cap Growth mutual funds under coverage. In fact, only 29 out of 8,057 funds under coverage charge higher TAC than DADGX. For comparison, the average TAC of all Small Cap Growth mutual funds under coverage is 1.98%, the weighted average is 1.16%, and the benchmark ETF (IWO) has total annual costs of 0.26%.
Our TAC metric accounts for more than just expense ratios. We consider the impact of front-end loads, back-end loads, redemption fees, and transaction costs. For example, DADGX’s front-end load adds 2.19% to its total annual costs and its annual turnover ratio of 190% adds 0.99% to its total annual costs – neither of which are captured by the expense ratio. Figure 6 shows our breakdown of DADGX’s total annual costs, which is available for all of the 8,000+ mutual funds under coverage.
Figure 6: Dunham Small Cap Growth Fund Total Annual Costs Breakdown
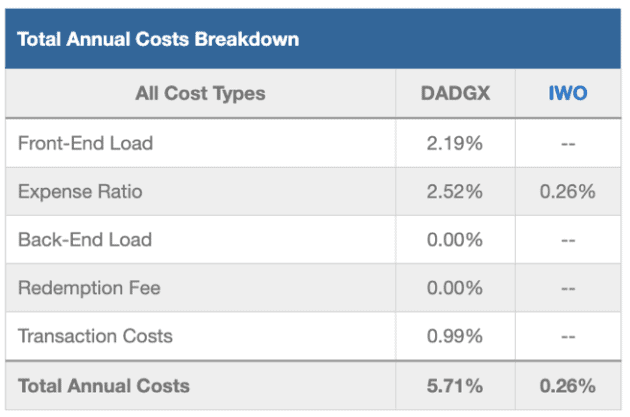
Sources: New Constructs, LLC and company, ETF and mutual fund filings
To justify its higher fees, each class of the fund must outperform its benchmark by the following over three years:
- DADGX must outperform by an average of 5.43% annually.
- DCDGX must outperform by an average of 4.05% annually.
- DNDGX must outperform by an average of 2.88% annually.
An in-depth analysis of DADGX and its TAC is available in our standard mutual fund report.
DADGX’s Performance Can’t Justify Its Fees
When we take into account its load, which adds 2.19% to its total annual costs, we see that DADGX has underperformed in recent years and failed to justify its fees.
DADGX’s 1-year quarter-end average annual total return underperformed IWO by over 600 basis points. Its 3-year quarter-end average annual total return bested IWO by 103 basis points, which is nowhere near enough to justify its fees, as noted above. Its 5 and 10-year quarter-end average annual total return each underperformed by 4 and 108 basis points respectively
Given that 62% of assets are allocated to stocks with Unattractive-or-worse ratings, DADGX looks likely to underperform moving forward.
The Importance of Holdings-Based Fund Analysis
Smart fund (or ETF) investing means analyzing the holdings of each mutual fund. Failure to do so is a failure to perform proper due diligence. Simply buying a mutual fund or ETF based on past performance does not necessarily lead to outperformance. Only through holdings-based analysis can one determine if a fund’s methodology leads managers to pick high-quality or low-quality stocks.
However, most investors don’t realize they can access sophisticated fundamental research using data that corrects market inefficiencies and generates alpha. Our Robo-Analyst technology analyzes the holdings of all 556 ETFs and mutual funds in the Small Cap Growth style and 8,000+ ETFs and mutual funds under coverage to avoid “the danger within.[2]” This diligence allows us to cut through the noise and identify potentially dangerous funds that traditional backward-looking fund research may overlook, such as DADGX.
Better Rated Small Cap Growth Funds
There are no Small Cap Growth mutual funds that earn an Attractive-or-better rating, which helps explain why it ranks last of the 12 investment styles in our 4Q19 Style Ratings for ETFs and Mutual Funds report. Investors looking for exposure to Small Cap Growth stocks should build their own portfolio of Attractive-or-better Small Cap Growth stocks instead of paying someone else to do it poorly.
This article originally published on October 21, 2019.
Disclosure: David Trainer, Kyle Guske II, and Sam McBride receive no compensation to write about any specific stock, sector, style, or theme.
Follow us on Twitter, Facebook, LinkedIn, and StockTwits for real-time alerts on all our research.
[1] Harvard Business School features the powerful impact of our research automation technology in the case study New Constructs: Disrupting Fundamental Analysis with Robo-Analysts.
[2] This paper compares our analytics on a mega cap company to other major providers.