
Nine new stocks make March’s Exec Comp Aligned with ROIC Model Portfolio, available to members as of March 13, 2020.
Recap from February’s Picks
Our Exec Comp Aligned with ROIC Model Portfolio (-20.7%) underperformed the S&P 500 (-18.7%) from February 14, 2020 through March 11, 2020. The best performing stock in the portfolio was up 3%. Overall, seven out of the 15 Exec Comp Aligned with ROIC Stocks outperformed the S&P from February 14, 2020 through March 11, 2020.
Only our research utilizes the superior data and earnings adjustments featured by the HBS & MIT Sloan paper,"Core Earnings: New Data and Evidence.” The success of this Model Portfolio highlights the value of our Robo-Analyst technology[1], which scales our forensic accounting expertise (featured in Barron’s) across thousands of stocks.
This Model Portfolio only includes stocks that earn an Attractive or Very Attractive rating and align executive compensation with improving ROIC. We think this combination provides a uniquely well-screened list of long ideas because return on invested capital (ROIC) is the primary driver of shareholder value creation.[2]
New Stock Feature for March: Kimberly-Clark Corp (KMB: $135/share)
Kimberly-Clark Corp (KMB) is the featured stock in March’s Exec Comp Aligned with ROIC Model Portfolio.
We first made KMB a Long Idea in November 2017 and reiterated it in May 2019. Since our initial report, the stock has outperformed the S&P 500 (up 19% vs S&P down 7%) and remains undervalued.
KMB has grown after-tax operating profit (NOPAT) by 2% compounded annually over the past five years and 2% compounded annually over the past two decades. The firm increased its NOPAT margin from 11% in 2014 to 13% in 2019. Additionally, KMB has shown a consistent ability to create shareholder value by generating positive economic earnings every year since 1998.
Figure 1: KMB’s Economic Earnings Since 2014
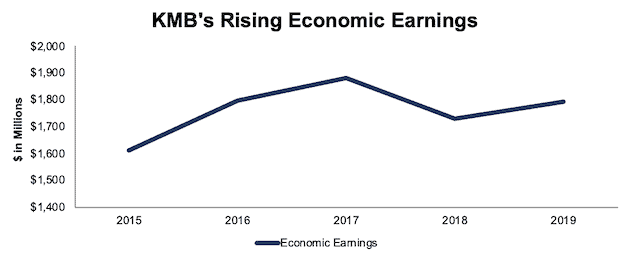
Sources: New Constructs, LLC and company filings
Executives Are Focused on Creating Shareholder Value
53% of KMB executives’ compensation consists of performance-based restricted share units (RSU’s). The performance objectives for these RSU’s are equally weighted between average annual adjusted net sales growth and average adjusted ROIC over a three-year period. In other words, nearly 27% of total executive compensation is tied directly to ROIC performance.
KMB’s focus on ROIC ensures intelligent capital allocation. KMB has grown economic earnings year-over-year (YoY) in 11 of the 16 years since KMB first included ROIC in its compensation plan in 2004. More recently, despite falling in 2019, KMB has still increased ROIC from 12% in 2014 to 15% in 2019.
Figure 2: KMB’s ROIC Since 2014
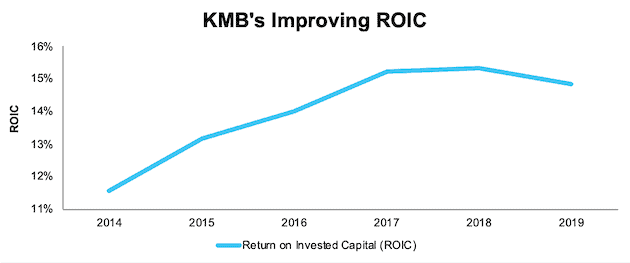
Sources: New Constructs, LLC and company filings
KMB Still Has Upside Potential
At its current price of $135/share, KMB has a price-to-economic book value (PEBV) ratio of 0.9. This ratio means the market expects KMB’s NOPAT to permanently decline by 10%. This seems overly pessimistic given its 2% compounded annual growth rate over the past two decades.
If KMB can maintain NOPAT margins of 13% (equal to 2019 NOPAT margin and the five-year average) and grow NOPAT by just 2% compounded annually for the next decade, the stock is worth $184/share today – a 36% upside. See the math behind this reverse DCF scenario.
Critical Details Found in Financial Filings by Our Robo-Analyst Technology
As investors focus more on fundamental research, research automation technology is needed to analyze all the critical financial details in financial filings as shown in the Harvard Business School and MIT Sloan paper, "Core Earnings: New Data and Evidence”.
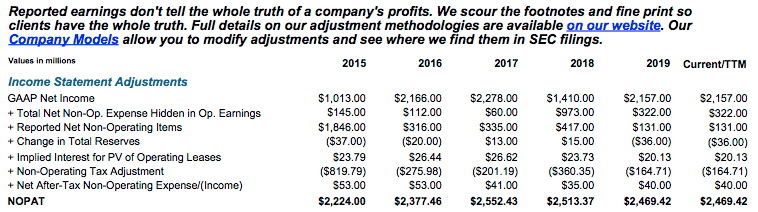
Below are specifics on the adjustments we make based on Robo-Analyst findings in Kimberly-Clark Corp’s 2019 10-K:
Income Statement: we made $1.6 billion of adjustments, with a net effect of removing $312 million in non-operating expenses (2% of revenue). You can see all the adjustments made to KMB’s income statement here.
Balance Sheet: we made $9.5 billion of adjustments to calculate invested capital with a net increase of $8.1 billion. One of the largest adjustments was $3.3 billion related to other comprehensive income. This adjustment represented 39% of reported net assets. You can see all the adjustments made to KMB’s balance sheet here.
Valuation: we made $10.6 billion of adjustments with a net effect of decreasing shareholder value by $10.6 billion. There were no adjustments that increased shareholder value. Apart from total debt, one of the largest adjustments to shareholder value was $937 million in underfunded pensions. This adjustment represents 2% of KMB’s market cap. See all adjustments to KMB’s valuation here. Despite these subtractions from shareholder value, KMB remains undervalued.
This article originally published on March 18, 2020.
Disclosure: David Trainer, Kyle Guske II, and Matt Shuler receive no compensation to write about any specific stock, style, or theme.
Follow us on Twitter, Facebook, LinkedIn, and StockTwits for real-time alerts on all our research.
[1] Harvard Business School features the powerful impact of our research automation technology in the case New Constructs: Disrupting Fundamental Analysis with Robo-Analysts.
[2] This paper compares our analytics on a mega cap company to Bloomberg and Capital IQ (SPGI) in a detailed appendix.