
Five new stocks made October’s Dividend Growth Stocks Model Portfolio, which was made available to members on October 27, 2022.
Recap From September’s Picks
On a price return basis, our Dividend Growth Stocks Model Portfolio (+5.5%) underperformed the S&P 500 (+6.1%) by 0.6%, and on a total return basis, the Model Portfolio (+5.6%) underperformed the S&P 500 (+6.1%) by 0.5%. The best performing stock outperformed the S&P 500 by 18%. Overall, 13 out of the 30 Dividend Growth Stocks outperformed the S&P 500 from September 29, 2022 through October 25, 2022.
This model portfolio mimics an “All Cap Blend” style with a focus on dividend growth. Selected stocks earn an Attractive or Very Attractive rating, generate positive free cash flow (FCF) and economic earnings, offer a current dividend yield >1%, and have a 5+ year track record of consecutive dividend growth. This model portfolio is designed for investors who favor long-term capital appreciation over current income, but still appreciate the power of growing dividends.
This report leverages our cutting-edge Robo-Analyst technology to deliver proven-superior[1] fundamental research and support more cost-effective fulfillment of the fiduciary duty of care.
Featured Stock From October: Snap-On Inc. (SNA: $221/share)
Snap-On Inc. (SNA) is the featured stock from October’s Dividend Growth Stocks Model Portfolio. We made SNA a Long Idea in February 2018. Since then, the stock is up 39% vs. a 37% gain for the S&P 500. See our latest report on SNA here.
Snap-On has grown revenue by 5% compounded annually and net operating profit after-tax (NOPAT) by 10% compounded annually since 2011. The company’s NOPAT margin rose from 12% in 2011 to 19% over the trailing twelve months (TTM), while return on invested capital (ROIC) rose from 11% in 2011 to 16% over the same time.
Figure 1: Snap-On’s Revenue and NOPAT Since 2011
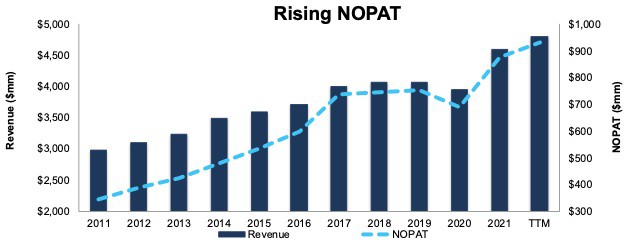
Sources: New Constructs, LLC and company filings
FCF Exceeds Dividends by a Wide Margin
Snap-On has increased its dividend in each of the past 12 years. The company increased its regular dividend from $2.95/share in 2017 to $5.11/share in 2021, or 15% compounded annually. The current quarterly dividend, when annualized, equals $5.68/share, and provides a 2.6% dividend yield. Snap-On last increased its dividend on November 4, 2021. Should the company increase its dividend for a 13th consecutive year, the dividend yield would be even higher at the current stock price.
More importantly, Snap-On’s strong free cash flow (FCF) easily exceeds the company’s growing dividend payments. From 2017 – 2021, Snap-On’s cumulative $2.9 billion (24% of enterprise value) in FCF is 2.6x the $1.1 billion paid out in dividends, per Figure 2. Over the TTM, the company generated $539 million in FCF and paid out $303 million in dividends.
Figure 2 also shows that Snap-On’s FCF significantly exceeded its dividend payments in each of the past five years.
Figure 2: Free Cash Flow vs. Regular Dividend Payments
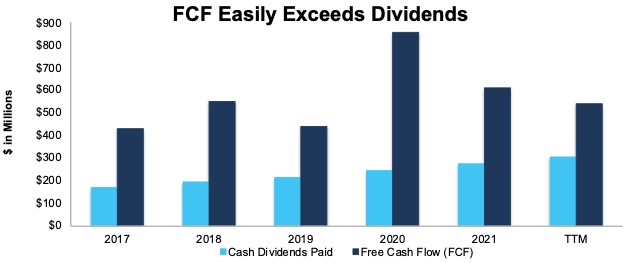
Sources: New Constructs, LLC and company filings
Companies with FCF well above dividend payments provide higher quality dividend growth opportunities because we know the company generates the cash to support a higher dividend. On the other hand, dividends that exceed FCF cannot be trusted to grow or even be maintained, due to insufficient cash flow.
Snap-On Has Upside Potential
At its current price of $221/share, SNA has a price-to-economic book value (PEBV) ratio of 0.9. This ratio means the market expects Snap-On’s NOPAT to permanently decline by 10%. This expectation seems overly pessimistic for a company that has grown NOPAT by 10% compounded annually since 2011 and 14% compounded annually since 2001.
Even if Snap-On’s NOPAT margin falls to 18% (five-year average) and the company grows revenue by just 4% compounded annually for the next 10 years, the stock would be worth $280+/share today – a 27% upside. In this scenario, Snap-On’s NOPAT would grow just 3% compounded annually over the next decade. See the math behind the reverse DCF scenario.
Should the company grow NOPAT more in line with historical growth rates, the stock has even more upside. Add in Snap-On’s 2.6% dividend yield and a history of dividend growth, and it’s clear why this stock is in October’s Dividend Growth Stocks Model Portfolio.
Critical Details Found in Financial Filings by Our Robo-Analyst Technology
Below are specifics on the adjustments we make based on Robo-Analyst findings in Snap-On’s 10-Ks and 10-Qs:
Income Statement: We made $111 million in adjustments with a net effect of removing $55 million in non-operating expenses (1% of revenue). Clients can see all adjustments made to Snap-On’s income statement on the GAAP Reconciliation tab on the Ratings page on our website.
Balance Sheet: We made $1.4 billion in adjustments to calculate invested capital with a net decrease of $233 million. The most notable adjustment was $344 million (6% of reported net assets) in other comprehensive income. Clients can see all adjustments made to Snap-On’s balance sheet on the GAAP Reconciliation tab on the Ratings page on our website.
Valuation: We made $1.9 billion in adjustments, with a net decrease to shareholder value of $547 million. Apart from total debt, the most notable adjustment to shareholder value was $663 million in excess cash. This adjustment represents 6% of Snap-On’s market value. Clients can see all adjustments to Snap-On’s valuation on the GAAP Reconciliation tab on the Ratings page on our website.
This article originally published on November 4, 2022.
Disclosure: David Trainer, Kyle Guske II, Matt Shuler, and Italo Mendonça receive no compensation to write about any specific stock, style, or theme.
Follow us on Twitter, Facebook, LinkedIn, and StockTwits for real-time alerts on all our research.
[1] Our research utilizes our Core Earnings, a more reliable measure of profits, as proven in Core Earnings: New Data & Evidence, written by professors at Harvard Business School (HBS) & MIT Sloan and published in The Journal of Financial Economics.