
This position was closed due to acquisition on May 3, 2019. Details in the Position Update report here.
Check out this week’s Danger Zone interview with Chuck Jaffe of Money Life.
To meet the expectations baked into its stock price, this firm must rapidly improve profitability while gaining significant market share. Achieving both at the same time is not impossible, but it is exceedingly difficult and rare. To date, this firm has shown few signs it has the ability to do both. The risk/reward proposition for investors looks unfavorable due to a combination of industry lagging profitability, alarming expense growth, poorly-aligned executive compensation incentives, and high market-implied expectations for future profits. The Ultimate Software Group (ULTI: $194/share) is this week’s Danger Zone pick.
Revenue Growth at Expense of Profits
Since 2014, ULTI’s revenue has grown 24% compounded annually to $781 million in 2016 and $861 million over the last twelve months (TTM). Over the same time, its after-tax profit (NOPAT) has fallen 11% compounded annually to $31 million in 2016 and $16 million TTM, per Figure 1. The disconnect between revenue and profits comes from rapidly declining margins. The company’s NOPAT margin fell from 8% in 2014 to 3% TTM.
Figure 1: ULTI’s NOPAT & Revenue Since 2014
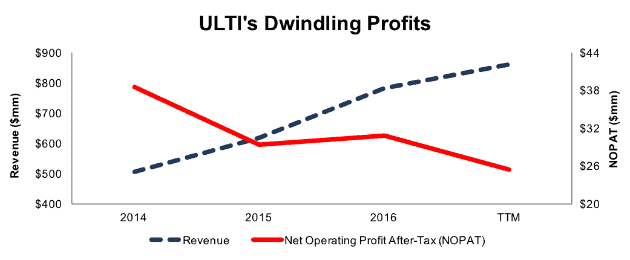
Sources: New Constructs, LLC and company filings
Declining margins and inefficient capital use have cratered ULTI’s return on invested capital (ROIC). ROIC has fallen from a once impressive 24% in 2014 to 7% TTM. At the same time, the company’s average invested capital turns have fallen from 5.2 in 2011 to 2.3 TTM. Further, the company has burned through $717 million (3% of market cap) in cumulative free cash flow over the past five years. The firm’s -$88 million in FCF over the last twelve months equates to a -2% FCF yield, which is well below the 2% average of the stocks in the S&P 500.
The company’s $111 million in cash currently on the books would support the TTM cash burn rate for just over one year before the company would need a cash infusion via debt or dilutive share issuance.
Compensation Plan Means Execs Get Paid While Depleting Shareholder Value
Ultimate Software Group’s executive compensation plan fails to properly align executives’ interests with shareholders’ interests. The misalignment drives the profit decline shown in Figure 1. Worse, the current compensation plan allows executives to earn large bonuses while shareholder value is destroyed. Executives’ cash bonuses are tied to the achievement of adjusted pre-tax operating income. This metric is conveniently adjusted to remove stock based compensation and amortization charges.
Long-term equity incentives are granted via time-based restricted stock awards, which lack specific performance based-criteria. The compensation committee reviews the executive’s long-term accomplishments, including revenue growth, profitability, cash flows and customer retention. Unfortunately, this focus has not led to true value creation. ULTI’s economic earnings have fallen from $12 million in 2012 to -$4 million TTM.
We’ve demonstrated through numerous case studies that ROIC, not revenue, customer retention, or non-GAAP metrics, is the primary driver of shareholder value creation. A recent white paper published by Ernst & Young also validates the importance of ROIC (see here: Getting ROIC Right) and the superiority of our data analytics. Without major changes to this compensation plan (e.g. emphasizing ROIC), investors should expect further value destruction.
Non-GAAP Metrics Hide Profitability Decline
Ultimate Software is among a long list of firms that use non-GAAP metrics, such as non-GAAP operating income and non-GAAP net income, to mask declining profitability. Our research digs deeper so our clients see through the illusory numbers. Below are some of the items Ultimate Software Group removes to calculate its non-GAAP net income:
- Stock-based compensation
- Amortization of acquired intangible assets
- Transaction costs related to business combinations
These adjustments have a large impact on the disparity between GAAP net income, non-GAAP net income, and economic earnings. Over the TTM period and 2016, ULTI removed $132 million (over 340% of GAAP net income) and $114 million (over 376% of 2016 GAAP net income), respectively, in stock-based compensation expense to calculate non-GAAP net income. Combined with other adjustments, ULTI reported TTM non-GAAP net income of $103 million. Per Figure 2, GAAP net income was $38 million and economic earnings were -$4 million TTM.
Figure 2: ULTI’s Misleading Non-GAAP Metrics
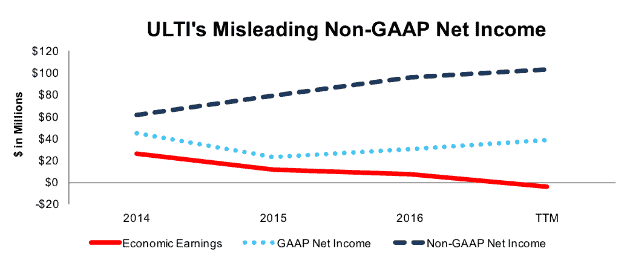
Sources: New Constructs, LLC and company filings
Lagging Margins are Worrisome in A Highly Competitive Market
Ultimate Software Group’s business covers a wide-range of employee life cycle services, beginning with recruitment and ending with retirement. Its standing within the Human Capital Management (HCM) market appears subject to the ability to compete largely on price. Competitors include Oracle (ORCL), with is PeopleSoft and Taleo products, Automatic Data Processing (ADP), Paychex (PAYX), Paycom (PAYC), SAP, and Ceridian. The proliferation of software-as-a-service in recent years has spurred increased competition in the market.
Per Figure 3, ULTI’s ROIC and NOPAT margin fall well below nearly all competitors/peers. In fact, the only firm with a lower margin is prior Danger Zone pick Workday (WDAY). Prior to 2017, WDAY had fallen 16% (compared to S&P 500 +20%) since our Danger Zone report as losses only grew larger. However, shares have risen 59% this year after WDAY announced deals with Wal-Mart and Amazon in early 2017. While the deals helped WDAY soar (though not improve profitability), they raise the competitive bar for other HCM providers by shrinking the pool of available clients.
Ultimately, success in the HCM market is largely dependent on service functionality, product enhancements, and price. The firms with the highest profitability have greater flexibility to invest in research & development, effectively acquire new customers, and ultimately undercut competitors pricing if necessary. Firm’s with lower profitability, such as Ultimate Software Group, often lack the flexibility to compete effectively in crowded markets and lack the internal resources to develop market leading products.
Figure 3: The Ultimate Software Group’s Profitability Ranks Near Last
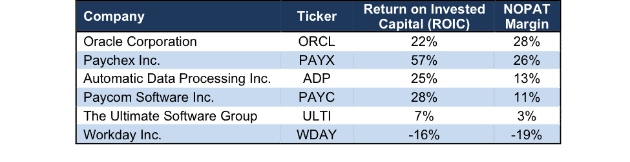
Sources: New Constructs, LLC and company filings
Bull Case Ignores ULTI’s Uphill Battle and Costly Customer Acquisition
In the world of software, cloud, and new technologies, “reaching scale” is often paramount to success. When a firm successfully scales the business, it is able to reach a critical mass where returns on incremental investments are high, and the business’ overall profitability improves. However, after nearly 30 years of operations, ULTI has yet to “reach scale.” At the end of 2016, ULTI reported it provided solutions to ~3700 clients. For comparison, Automatic Data Processing (ADP) reported it serves over 700,000 clients in its most recent 10-K, with its WorkForce Now platform serving over 60,000 mid-sized businesses.
The more pressing matter for ULTI is that the firm is spending at unsustainable levels in its quest to reach scale. In order to compete and grow market share, ULTI has spent heavily on sales personnel and administrative operations. Per Figure 4, General & Administrative and Sales & Marketing costs have grown at nearly double the rate of revenue since 2014. G&A has grown 41% compounded annually, S&A has grown 38% compounded annually, and revenue has grown 24% compounded annually. With the significant growth in costs, any increase in revenue has been nullified as costs have eaten away at margins, as mentioned to earlier. Spending $2 to acquire $1 in revenue is not a winning strategy when there are numerous other competitors in the market that can easily afford to match pricing or discounts while remaining profitable.
Figure 4: ULTI’s Expenses Outpacing Revenue Growth

Sources: New Constructs, LLC and company filings
In addition, cost of revenue and research & development have grown at 21% compounded annually and 20% compounded annually respectively. The growth in expenses creates a catch-22 for ULTI. The company must spend heavily to market and advertise its products and grow market share, which limits margin upside. However, cutting expenses to grow profits caps the company’s potential market share (estimated 6% of total addressable market). A firm can certainly choose between focusing on market share or profitability, and investors will overlook issues in the short-term. Furthermore, the firm may be forced to choose one or the other as its need for capital draws near. The company’s $111 million in cash currently on the books would support its TTM cash burn rate for just over one year before the company would need a cash infusion via debt or dilutive share issuance.
The larger issue arises when one looks at the valuation of ULTI and find that the expectations embedded in the current share price imply both market share growth and increased profitability. Essentially, the expectations baked into Ultimate Software Group’s stock price imply that the firm will reverse years of profit declines, more than double margins, and grow revenue at rapid rates, as we’ll show below.
ULTI’s Valuation Implies Unrealistic Profit Growth & Market Share Gains
ULTI has risen 87% over the past five years and 6% year-to-date while the S&P 500 has risen 79% and 14% over the same time frames. This performance has occurred despite NOPAT and ROIC declining. This move in the stock has widened the chasm between the company’s current financial performance and the significantly higher profits implied by the stock’s market value.
Figure 5 shows ULTI and its peers compared on the basis of ROIC and enterprise value divided by invested capital (a cleaner version of price to book). As you can see, ROIC explains 67% of the changes in valuation for ULTI’s application software peers.
Figure 5: ROIC Explains 67% of Valuation for the Systems Software Market
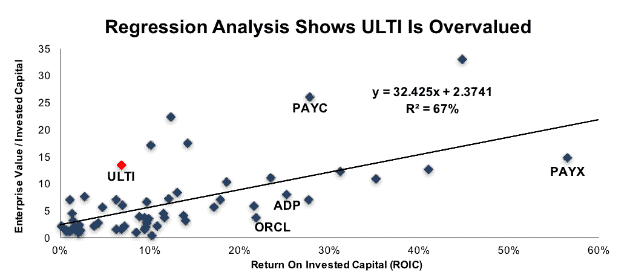
Sources: New Constructs, LLC and company filings
ULTI stands out as an outlier in Figure 5 and trades at a significant premium to its peers. If the stock were to trade a parity with the peer group, it would be $66/share – 66% below the current stock price. Given the firm’s deteriorating fundamentals it should be clear ULTI does not deserve such a premium valuation.
Our discounted cash flow model quantifies the expectations baked into that premium valuation. To justify its current price of $194/share, ULTI must immediately achieve 8% NOPAT margins (highest in company history, compared to 3% TTM) and grow NOPAT by 27% compounded annually for the next 13 years. This scenario seems overly optimistic given the firm’s declining profitability in recent years. In this scenario, ULTI would be generating $8.3 billion in revenue, which would equate to 58% of currently addressable market and 37% of the expected market in the year 2022. It’s clear the expectations already baked into the stock price require ULTI to take significant market share, despite its lack of competitive advantage.
Even if we assume ULTI can achieve a 5% NOPAT margin (average of last five years) and grow NOPAT by 20% compounded annually for the next decade, the stock is still worth only $64/share today – a 67% downside.
Each of these scenarios also assumes ULTI is able to grow revenue, NOPAT and FCF without increasing working capital or investing in fixed assets. This assumption is unlikely but allows us to create optimistic scenarios that demonstrate just how high expectations embedded in the current valuation really are. For reference, ULTI’s invested capital has grown $62 million on average (8% of 2016 revenue) each year for the past five years.
Is ULTI Worth Acquiring?
The largest risk to any bear thesis is what we call “stupid money risk”, which means an acquirer comes in and pays for ULTI at the current, or higher, share price despite the stock being overvalued. Large and more profitable competitors in the market make an acquisition less likely. Competitors would be better suited to use their competitive advantage to outprice ULTI rather than ignore prudent stewardship of capital and destroy substantial shareholder value in an acquisition.
We show below how expensive ULTI remains even after assuming an acquirer can achieve significant synergies. Additionally, management would have preferred a sale already take place were one to occur. ULTI’s compensation committee has taken steps in recent years to lower the incentive for executives to sell the firm. In fact, in February 2017, the compensation committee terminated ULTI’s Change in Control Plan that would have provided cash payouts to named executives. Rather, the committee awarded restricted stock awards to unwind the CIC plan. In light of this change in compensation, we feel a sale of the firm is less likely.
Walking Through the Acquisition Value Math
To begin, Ultimate Software Group has liabilities of which investors may not be aware that make it more expensive than the accounting numbers suggest.
- $52 million in off-balance-sheet operating leases (1% of market cap)
- $39 million in outstanding employee stock options (1% of market cap)
After adjusting for these liabilities, we can model multiple purchase price scenarios. Even in the most optimistic of scenarios, ULTI is worth less than its current share price.
Figures 6 and 7 show what we think ADP should pay for ULTI to ensure it does not destroy shareholder value. ADP could grow market share by purchasing ULTI and increase its enterprise business. However, there are limits on how much ADP would pay for ULTI to earn a proper return, given the NOPAT and free cash flows (or lack thereof) being acquired.
Each implied price is based on a ‘goal ROIC’ assuming different levels of revenue growth. In both scenarios, the estimated revenue growth rate is 20% in year one and two, which is the consensus estimate of revenue growth for the next two years. For the subsequent years, we use 20% in scenario one because it represents a continuation of next year’s expectations. We use 30% in scenario two because it assumes a merger with ADP would create revenue synergies thorough increased exposure to ADP’s large customer base.
We conservatively assume that ADP can grow ULTI’s revenue and NOPAT without spending anything on working capital or fixed assets beyond the original purchase price. We also assume ULTI immediately achieves an 8% NOPAT margin, which is the average of ADP’s and ULTI’s current NOPAT margin. For reference, ULTI’s TTM NOPAT margin is 3%, so this assumption implies immediate improvement and allows the creation of a truly best-case scenario.
Figure 6: Implied Acquisition Prices for ADP To Achieve 7% ROIC
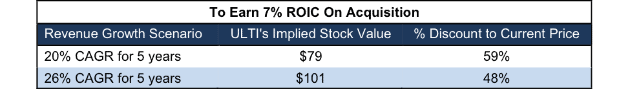
Sources: New Constructs, LLC and company filings.
Figure 6 shows the ‘goal ROIC’ for ADP as its weighted average cost of capital (WACC) or 7%. Even if ULTI can grow revenue by 26% compounded annually with an 8% NOPAT margin for the next five years, the firm is worth less than its current price of $194/share. It’s worth noting that any deal that only achieves a 7% ROIC would be only value neutral and not accretive, as the return on the deal would equal ADP’s WACC.
Figure 7: Implied Acquisition Prices for ADP To Achieve 25% ROIC
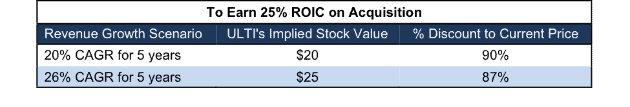
Sources: New Constructs, LLC and company filings.
Figure 7 shows the next ‘goal ROIC’ of 25%, which is ADP’s current ROIC. Acquisitions completed at these prices would be truly accretive to ADP shareholders. Even in the best-case growth scenario, the most ADP should pay for ULTI is $25/share (87% downside to current valuation). Even assuming this best-case scenario, ADP would destroy over $5 billion by purchasing ULTI at its current valuation. Any scenario assuming less than 26% compound annual growth in revenue would result in further capital destruction for ADP.
An Earnings Disappointment or Dilutive Events Could Tank Shares
Expectations for ULTI’s earnings have been significantly cut following the most recent earnings release. In the release, ULTI lowered prior guidance for revenue growth and operating margin for the full year 2017 and the stock fell 12% the following day. The company blamed the lowered guidance on an increase in “time-to-live” times for its enterprise and mid-market offerings. Delayed deployment could be the result of any number of issues, but the most damaging result would be if clients leave for a competing service that can be deployed in shorter time.
Despite the guidance cut, the company is still expecting upwards of 20% revenue growth and expectations remain high. As the market grows more competitive and ULTI’s customer acquisition costs continue rising, we believe margins will continue to be pressured and an earnings miss may be on the horizon. Such a miss could send shares down to more rational levels. Apart from the 12% drop in August, shares also fell 6% in one day following 1Q17 earnings that missed revenue expectations.
Apart from an earnings miss causing the market to send shares to a more rational level, investors carry significant dilution risk. As noted earlier, the current cash burn can only be sustained for just over one year. If the cash burn is not halted, ULTI will need a capital infusion through a dilutive secondary offering or debt issuance which brings on investors with more senior claims to cash flows. In either event, current shareholders would see the value of their investment eroded and ULTI could fall in accordance with this risk.
While we don’t attempt to predict exactly when the market will recognize the disconnect between expectations and reality, we know the impact of failing to meet expectations can be highly negative.
Insider Trading is Minimal While Short Interest is Rising
Over the past six months, 26 thousand insider shares have been purchased and 10 thousand have been sold for a net effect of 16 thousand insider shares purchases. These purchases represent less than 1% of shares outstanding.
Short interest is currently 3.1 million shares, which equates to 10% of shares outstanding and over 9 days to cover. There has been a significant jump in short interest this year, as the number of shares sold short has increased 72% since the end of 2016. Growing short interest would seem to imply we’re not the only ones who recognize the issues facing ULTI and its lofty valuation.
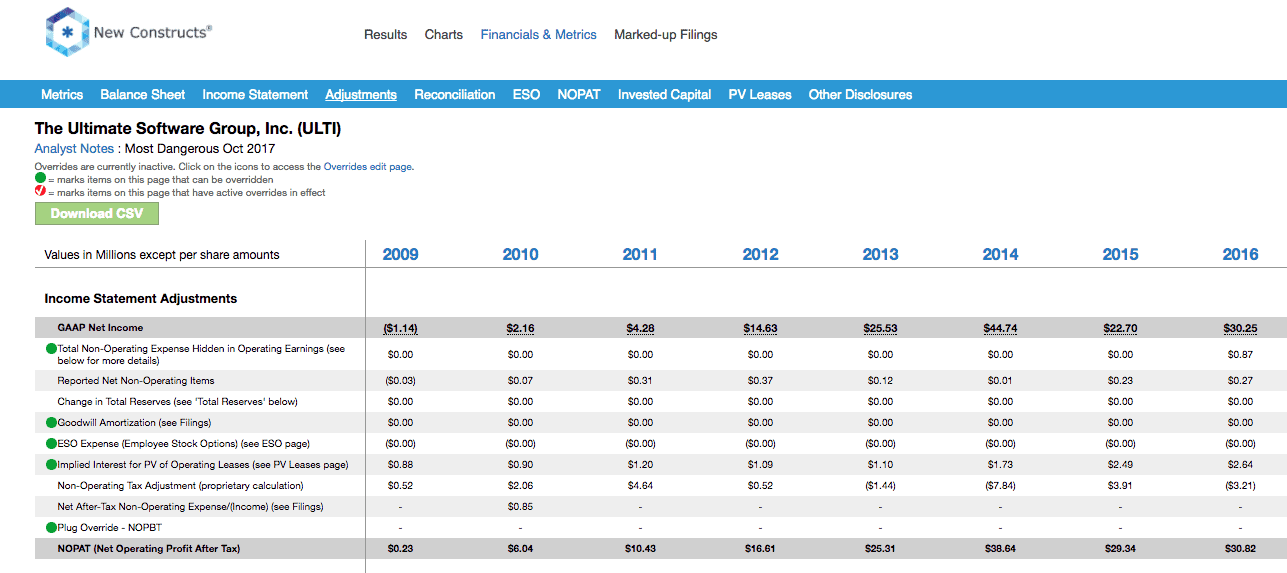
Auditable Impact of Footnotes & Forensic Accounting Adjustments[1]
Our Robo-Analyst technology enables us to perform forensic accounting with scale and provide the research needed to fulfill fiduciary duties. In order to derive the true recurring cash flows, an accurate invested capital, and an accurate shareholder value, we made the following adjustments to The Ultimate Software Group’s 2016 10-K:
Income Statement: we made $8 million of adjustments with a net effect of removing less than $1 million in non-operating expense (<1% of revenue). We removed $4 million related to non-operating expenses and $4 million related to non-operating income. See all the adjustments made to ULTI’s income statement here.
Balance Sheet: we made $263 million of adjustments to calculate invested capital with a net decrease of $133 million. The most notable adjustment was $79 million (18% of reported net assets) related to deferred tax assets. See all adjustments to ULTI’s balance sheet here.
Valuation: we made $169 million of adjustments with a net effect of decreasing shareholder value by $33 million. The largest adjustment to shareholder value was $62 million in total debt, which includes $52 million in off-balance sheet operating leases. This lease adjustment represents less than 1% of ULTI’s market cap.
Unattractive Funds That Hold ULTI
The following funds receive our Unattractive-or-worse rating and allocate significantly to The Ultimate Software Group.
- Artisan Small Cap Fund (APHSX) – 2.9% allocation and Unattractive rating
- Waddell & Reed Advisors Small Cap Fund (WRSYX) – 2.7% allocation and Unattractive rating
- Ivy Small Cap Growth Fund (IYSTX) – 2.6% allocation and Very Unattractive rating
This article originally published on October 23, 2017.
Disclosure: David Trainer, Kyle Guske II, and Kenneth James receive no compensation to write about any specific stock, style, or theme.
Follow us on Twitter, Facebook, LinkedIn, and StockTwits for real-time alerts on all our research.
[1] Ernst & Young’s recent white paper, “Getting ROIC Right”, proves the superiority of our research and analytics.
Click here to download a PDF of this report.
Photo Credit: Danne (Pexels)