We have long warned against using traditional metrics such as price-to-earnings (P/E) and price-to-book (P/B) and suggest investors use updated and more rigorous valuation methods, such as those detailed in Value Investing 2.0. Finding ETFs that do not rely on traditional metrics and allocate to quality stocks is difficult, but we did find one recently.
While the ETF’s performance since its inception in 2014 hasn’t been outstanding (annualized returns of 3% over the past five years), our unique ETF research reveals that this ETF offers excellent risk/reward. Alpha Architect U.S. Quantitative Value ETF (QVAL) is this week’s Long Idea.
Our Research Looks Forward, Not Backward
With annualized returns over the past three years of -2% versus 1% for the benchmark, iShares Russell Mid-Cap Value ETF (IWS), many investors might overlook this ETF. This underperformance certainly drives Morningstar’s 1-Star rating.
On the other hand, looking forward instead of backward, we assign QVAL our best rating: Very Attractive. We base our forward-looking Fund Ratings on in-depth analysis of the holdings of funds.
Figure 1: Alpha Architect U.S. Quantitative Value ETF Ratings

Sources: New Constructs, LLC, company filings, and Morningstar
To properly evaluate any ETF, including QVAL, one must analyze the filings, including the footnotes and MD&A, of each of the ETF’s holdings. This diligence takes an enormous amount of time and is unavailable to most without the aid of technology.
Our Robo-Analyst technology[1] allows us to apply our superior fundamental analysis to all the holdings in an ETF. By leveraging this technology, we’re able to find ETFs, like QVAL, with holdings and methodology that suggest future performance should be strong.
Holdings Research Reveals a Strong Stock-Selection Methodology
Alpha Architect U.S. Quantitative Value ETF managers’ investment process systematically and automatically chooses the “cheapest, highest quality value stocks” based on a variety of fundamental metrics.
Instead of using traditional metrics such as price-to-earnings and price-to-book ratios, the firm uses earnings before interest and taxes / total enterprise value (EBIT/TEV). While not identical, this metric is closer to the free cash flow (FCF) yield calculation used in our overall risk/reward ratings than more traditional metrics.
Additionally, the managers use free cash flow, return on capital, and margin performance to identify “economic moat”, which is used to determine the overall quality of a stock.
The managers also try to account for the unreliability of reported numbers by using “forensic accounting screens” that look for differences between reported earnings and cash from operations.
Mentioning the use of rigorous metrics or analysis that goes beyond reported numbers in its methodology is not enough to ensure a quality portfolio. The managers of the ETF must put their money where their mouth is and follow through on their stated strategy. We’ve seen mutual funds with a good methodology on paper that have low-quality and overvalued holdings in practice.
Through our holdings analysis, we know this ETF’s automated process picks more attractive stocks compared to its style benchmark, the iShares Russell Mid Cap Value ETF (IWS).
Figure 2 shows that QVAL allocates a significantly higher percentage of its assets to Attractive-or-better rated stocks and a significantly lower percentage to Neutral-or-worse rated stocks than its style benchmark.
Figure 2: QVAL Allocates Capital to Superior Holdings

Sources: New Constructs, LLC and company filings
Per Figure 2, QVAL allocates 78% of its assets to Attractive-or-better rated stocks compared to just 25% for IWS. On the flip side, QVAL allocates 0% of its assets to Unattractive-or-worse rated stocks compared to 36% for IWS.
Given this favorable allocation relative to the benchmark, QVAL appears well-positioned to capture more upside with lower risk. Compared to the average ETF, QVAL has a much better chance of generating the outperformance required to justify its fees.
Superior Stock Selection Drives Superior Risk/Reward
By including free cash flow, return on capital, and EBIT/TEV in its stock-picking methodology, we find that QVAL allocates to stocks with low price-to-economic book value (PEBV) ratios, high FCF yields, low growth appreciation periods (GAP), high return on invested capital (ROIC), and positive economic earnings.
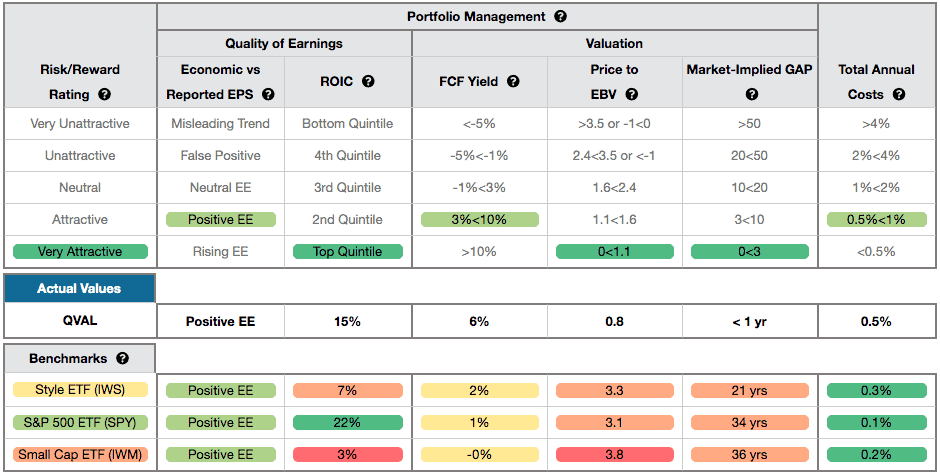
QVAL’s ROIC of 15% ranks in the top-quintile of our coverage universe and well above the 7% earned by IWS’ holdings.
Figure 3 contains our detailed rating for QVAL, which includes each of the criteria we use to rate all ETFs under coverage. These criteria are the same for our Stock Rating Methodology, because the performance of an ETF’s holdings equals the performance of the ETF after fees.
Figure 3: Alpha Architect U.S. Quantitative Value ETF (QVAL) Rating Breakdown
Sources: New Constructs, LLC and company filings
QVAL Finds Cheap Stocks Too
QVAL’s holdings are also superior to IWS (click here for our report on IWS) in all three valuation categories:
- QVAL’s free cash flow yield of 6% is higher than IWS (2%) and SPY (1%).
- The PEBV ratio for QVAL is 0.8, which is less than the 3.3 for IWS holdings and the 3.1 of SPY holdings.
- Our discounted cash flow analysis reveals an average market implied growth appreciation period (GAP) of less than one year for QVAL’s holdings compared to 21 years for IWS and 34 years for the SPY.
In other words, the stocks held by QVAL generate quality cash flows and have lower valuations compared to IWS. The market expectations for stocks held by QVAL imply permanent profit decline (measured by PEBV ratio) while the expectations embedded in IWS’s holdings imply a more than tripling of profits. High historical profits and low expectations for future profits are an attractive combination.
39 of QVAL’s 40 holdings are in our coverage universe. Of these 39 holdings:
- none receives a Risk/Reward rating below Neutral
- each has a PEBV ratio of 1.2 or less
- each has a GAP of eight years or less.
Given its focus on quality and valuation, it’s no wonder that 30% of the ETF’s holdings are stocks we’ve featured as Long Ideas. Figure 4 shows the 12 holdings that are also open Long Ideas.
Figure 4: Open Long Ideas That Are QVAL Holdings
Sources: New Constructs, LLC
Above Average Costs Are Offset by Quality Holdings
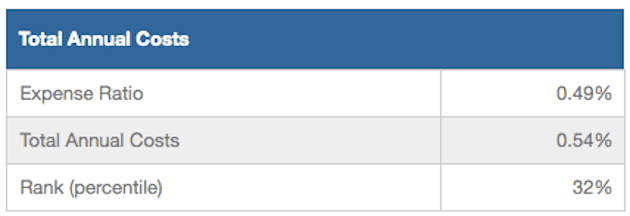
QVAL’s 0.54% total annual costs (TAC) are above the weighted average of all Mid Cap Value ETFs under coverage, which sits at 0.21%. However, QVAL justifies its costs by executing an intelligent investment strategy and being only one of two Mid Cap Value ETFs to earn a Very Attractive Portfolio Management Rating.
Figure 5 shows our breakdown of QVAL’s total annual costs, which is available for all of the 7,000+ mutual funds and 400+ ETFs under coverage.
Figure 5: QVAL’s Annual Costs
Sources: New Constructs, LLC and company filings
A Closer Look at a Quality Holding
We made HCA Healthcare Inc (HCA: $133/share) a Long Idea in June 2020. Since then, the stock is up 35% while the S&P 500 up 13%. Despite the price increase, the stock continues to earn a Very Attractive rating and remains on our Focus List - Long.
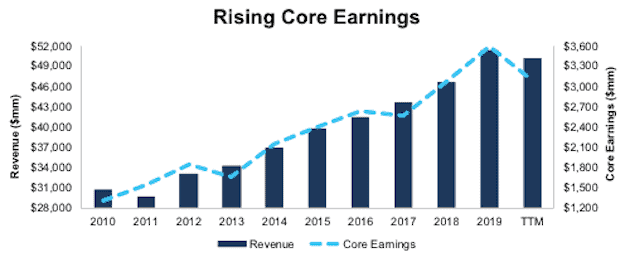
HCA Healthcare has grown its core earnings[2] by 11% compounded annually over the past five years and 12% compounded annually over the past decade. The firm improved its ROIC from 14% in 2009 to 16% in 2019. COVID-19-related disruptions to the firm’s business have brought its TTM ROIC lower to 14%. HCA Healthcare has also generated positive free cash flow (FCF) in each of the past 12 years. Over the past five years, the firm has generated $14.6 billion (33% of market cap) in FCF and its TTM FCF of $9.8 billion gives the firm a 12% FCF yield, which is much higher than the Healthcare sector’s FCF yield of -1%.
Figure 6: Revenue & Core Earnings Since 2010
Sources: New Constructs, LLC and company filings
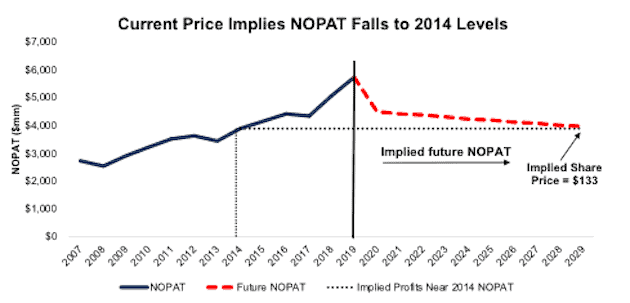
At its current price of $133/share, HCA Healthcare has a price-to-economic book value (PEBV) ratio of 0.7. This ratio means the market expects HCA Healthcare’s NOPAT to permanently decline by 30%. This expectation seems overly pessimistic for a firm that has grown NOPAT by 8% compounded annually over the past five years and 7% compounded annually over the past decade.
The current stock price implies HCA Healthcare’s NOPAT margin falls to 9% (all-time low) and NOPAT falls by 4% compounded annually for the next decade. See the math behind this reverse DCF scenario. In this scenario NOPAT falls to 2014 levels and its NOPAT in 2029 is still 31% below 2019 levels.
Figure 7: Current Price Implies NOPAT Falls 31% Below 2019 Levels
Sources: New Constructs, LLC and company filings
Big Upside Even If HCA Healthcare Grows NOPAT by Less Than 1% Compounded Annually
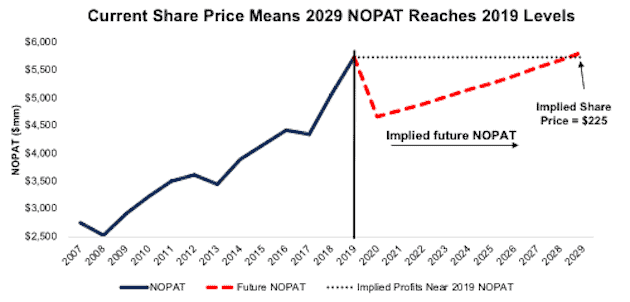
In a more optimistic scenario, where HCA Healthcare’s NOPAT margin falls to 9% (all-time low) and the firm grows NOPAT by less than 1% compounded annually for the next decade, the stock is worth $225/share today – a 69% upside. See the math behind this reverse DCF scenario. In this scenario NOPAT reaches 2019 levels in 2029.
Figure 8: Huge Upside With Minimal NOPAT Growth
Sources: New Constructs, LLC and company filings
Not All Holdings Are the Highest Quality
Given that none of QVAL’s assets are allocated to stocks with an Unattractive-or-worse rating, it is more difficult to find a stock that does not offer good risk/reward. However, not all stocks, such as The Timken Company (TKR: $60/share) are as profitable as their reported earnings would have you believe. Timken is the only holding with a Neutral risk/reward rating and Miss Earnings Distortion Score.
Over the TTM, Timken had over $21 million in net earnings distortion that cause earnings to be overstated. Unusual income hidden and reported in Timken Company’s filings include:
- $13 million in other income – 2019 10-K
- $2.1 million in other income through 1H20 – 2Q20 10-Q in other income
- $10.2 million in non-service pension and other postretirement income – 2019 10-K
This unusual income is partially offset by non-operating expenses such as:
- $6.6 million in severance and related benefit costs and exit costs
- $3.5 million in 1Q20
- $3.1 million in 2Q20
- $6.8 million in impairment and restructuring charges – 2019 10-K
- $5.3 million in non-service pension and other postretirement expense – 2Q20 10-Q
- $1.6 million in loss on sale of assets – 2Q20 10-Q
In addition, we made a $12.7 million adjustment for income tax distortion. This adjustment normalizes reported income taxes by removing the impact of unusual items.
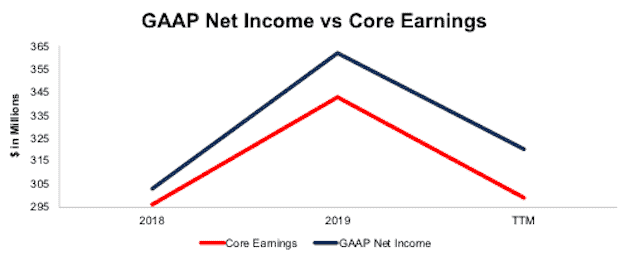
After removing earnings distortion, we find that Timken’s TTM core earnings of $299 million are lower than GAAP net income of $320 million, per Figure 9.
Figure 9: GAAP Net Income vs. Core Earnings Since 2018
Sources: New Constructs, LLC and company filings
While Timken’s stock has an Attractive PEBV ratio of 1.1, FCF yield of 5%, and market-implied GAP of just six years, there are better stocks, from an earnings-quality perspective, available in the market.
The Importance of Holdings Based Fund Analysis
Smart ETF (or fund) investing means analyzing the holdings of each ETF. Failure to do so is a failure to perform proper due diligence. Simply buying a mutual fund or ETF based on past performance does not necessarily lead to outperformance. Only through holdings-based analysis can one determine if an ETF is sticking to its stated methodology and is allocating to undervalued, high-quality stocks, as QVAL does.
However, most investors don’t realize they can already get the sophisticated fundamental research[3] that corrects market inefficiencies and generates alpha. Our Robo-Analyst technology analyzes the holdings of all 145 ETFs and mutual funds in the Mid Cap Value style and 7,000+ ETFs and mutual funds under coverage to avoid “the danger within.” For reference, the number of holdings in these Mid Cap Value ETFs and mutual funds varies from just 31 stocks to 698 stocks in a given fund. Our diligence on holdings allows us to cut through the noise and find ETFs, like Alpha Architect Quantitative Value ETF, with a portfolio and methodology that suggests future performance will be strong.
This article originally published on October 14, 2020.
Disclosure: David Trainer, Kyle Guske II, and Matt Shuler receive no compensation to write about any specific stock, style, or theme.
Follow us on Twitter, Facebook, LinkedIn, and StockTwits for real-time alerts on all our research.
[1] Harvard Business School features our Robo-Analyst research automation technology in the case New Constructs: Disrupting Fundamental Analysis with Robo-Analysts.
[2] Our core earnings are a superior measure of profits, as demonstrated in Core Earnings: New Data & Evidence a paper by professors at Harvard Business School (HBS) & MIT Sloan. The paper empirically shows that our data is superior to “Operating Income After Depreciation” and “Income Before Special Items” from Compustat, owned by S&P Global (SPGI).
[3] Compare our analytics on a mega cap company to Bloomberg and Capital IQ’s (SPGI) analytics in the detailed appendix of this paper.
