We’ve long argued (and proven empirically) that there is a strong correlation between improving return on invested capital (ROIC)[1] and increasing shareholder value. Nevertheless, the majority of mutual fund managers continue to pick stocks using accounting-based metrics such as price-to-earnings ratios, return on equity, or accounting book value.
We analyze[2] these metrics for all the holdings of over 7,500 U.S. ETFs and mutual funds daily to identify which fund managers put their analytical money where their mouth is. Occasionally, we come across a fund whose managers look beyond accounting earnings in their investment strategy.
This week we are featuring one such fund, the Hennessy Cornerstone Large Growth Fund (HFLGX), as this week’s Long Idea.
Backwards Looking Research Underrates this Fund
Hennessy Cornerstone Large Growth Fund has narrowly underperformed its benchmark, the iShares Russell 3000 ETF (IWV), since its inception in 2009. As a result, the individual investor share class (HFLGX) has a 3-star rating from Morningstar, while the institutional investor class (HILGX) has a 4-star rating.
However, research from Morningstar itself shows there’s almost no difference in the long-term returns of 3-star vs. 5-star funds.
Instead of looking at past performance, we analyze funds based on their holdings. When viewed through our Predictive Risk/Reward Fund Rating methodology, all share classes earn a Very Attractive rating. In fact, Hennessy Cornerstone Large Growth Fund is our top-rated mutual fund out of over 7,000 mutual funds we cover. Higher quality holdings and below average costs mean HFLGX is more likely to outperform moving forward, which is something traditional fund research does not tell you.
Figure 1: Hennessy Cornerstone Large Growth Fund Ratings

Sources: New Constructs, LLC, company filings, and Morningstar
Holdings Research Reveals Stock Methodology Based on ROIC
HFLGX’s managers use an investment philosophy that emphasizes return on invested capital (ROIC). From the fund’s management commentary:
“We believe return on capital is an excellent measure of a company’s profitability and is often associated with able management, high barriers to entry, and other favorable factors. As a result, we believe this measure can help uncover stocks with the potential to outperform the market.”
HFLGX’s holdings are selected using a quantitative process that starts by identifying companies with the highest one-year return on total capital. The fund selects the 50 stocks with the highest return on capital that also meet the following criteria:
- Above average market capitalization
- Price-to-cash flow ratio below the median
- Positive total capital
This investment process helps management pick higher quality stocks and avoid riskier stocks compared to its benchmark. Figure 2 shows that HFLGX allocates a significantly higher percentage of its assets to Attractive-or-better rated stocks and a significantly lower percentage to Unattractive-or-worse rated stocks than its benchmark, the iShares Russell 3000 ETF (IWV).
Figure 2: HFLGX Asset Allocation Compared to IWV

Sources: New Constructs, LLC and company filings
Per Figure 2, HFLGX allocates 60% of its assets to Attractive-or-better rated stocks compared to just 16% for IWV. On the flip side, HFLGX allocates 8% of its assets to Unattractive-or-worse rated stocks compared to 36% for IWV.
Given this favorable allocation relative to the benchmark, Hennessy Cornerstone Large Growth Fund. appears well positioned to capture more upside with lower risk. Compared to the average mutual fund, HFLGX has a much better chance of generating the outperformance required to justify its fees.
Superior Stock Selection Drives Superior Risk/Reward
With a focus on ROIC, one would expect HFLGX’s managers to excel at finding companies with higher-quality earnings and lower-risk valuations. Per Figure 3, they do just that.
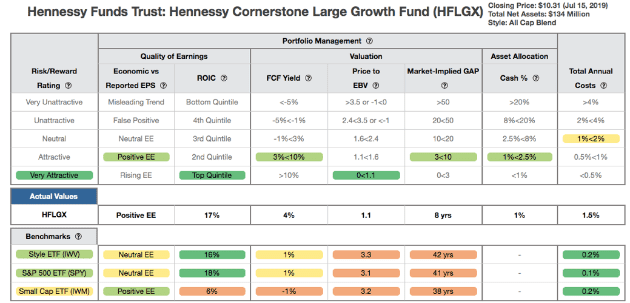
Figure 3 contains our detailed rating for HFLGX, which includes each of the criteria we use to rate all funds under coverage. These criteria are the same for our Stock Rating Methodology, because the performance of a fund’s holdings equals the performance of a fund after fees.
Figure 3: Hennessy Cornerstone Large Growth Fund Rating Breakdown

Sources: New Constructs, LLC and company filings
As Figure 3 shows, HFLGX’s holdings are superior to IWV in all five of the criteria that make up our holdings analysis:
- HFLGX’s return on invested capital (ROIC) is 17%, which is greater than the 16% earned by IWV.
- HFLGX’s free cash flow yield of 4% is four times that of IWV and the S&P 500 (SPY) at 1%.
- The price to economic book value (PEBV) ratio for HFLGX is 1.1, which is less than the 3.3 for IWV holdings and the 3.1 of SPY holdings.
- Our discounted cash flow analysis reveals an average market implied growth appreciation period (GAP) of just eight years for HFLGX holdings compared to 42 years for IWV and 41 years for SPY.
Ultimately, the stocks held by HFLGX generate superior cash flows (as measured by ROIC) compared to IWV, yet the market expects stocks held by IWV to grow profits by more than double that of HFLGX stocks.
Costs Are Reasonable, But Could Be Lower
Not only does HFLGX offer high-quality stock selection, it does so at a reasonable price. The fund’s total annual costs of 1.53% put it below the All Cap Blend average of 1.8%. HILGX is cheaper at 1.21%, but its $250,000 initial minimum puts it beyond the reach of the average investor.
While both HFLGX and HILGX offer reasonable fees, the quantitative nature of the fund’s selection process and its low annual turnover leaves room for lower fees. We hope that if the fund grows larger – it currently has ~$135 million in total assets – its fees will fall.
Deep Dive on A High Quality Holding
We can see how HFLGX’s methodology leads it to pick high-quality stocks by looking at one of its holdings, Cummins Inc. (CMI: $172/share).
CMI meets the criteria that drive HFLGX’s investment decisions – high ROIC and an undervalued stock price. Its 16% ROIC (up from 11% in 2016) puts it in the top quintile of all 2,800+ companies under our coverage. These factors also explain why we made CMI a Long Idea on 11/14/18. Since we published that article, the stock has outperformed the S&P 500 (up 18% vs. S&P up 11%) and it continues to earn our Very Attractive rating.
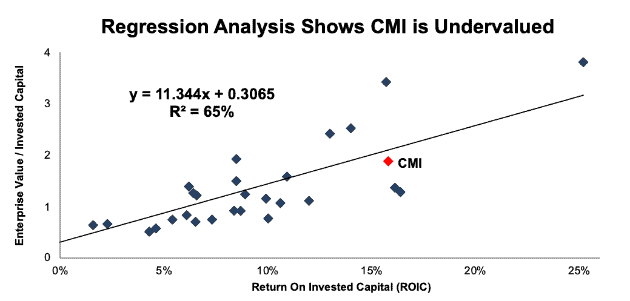
Despite this recent strong stock performance, CMI remains undervalued. Figure 4 shows that ROIC explains 65% of valuation for the 31 Auto, Truck, and Motorcycle Parts stocks under coverage. CMI trades at a discount to these peers, as shown by its position below the trendline.
Figure 4: ROIC Explains 65% of Valuation for Auto, Truck, and Motorcycle Parts Stocks

Sources: New Constructs, LLC and company filings
If CMI were to trade at parity with its peers, it would be worth $192/share – a 12% upside to the current stock price. We would argue that CMI deserves to trade at a premium valuation based on its rapidly improving ROIC.
At its current price of $172/share, CMI has a price-to-economic book value (PEBV) ratio of 0.9. This ratio means the market expects CMI’s NOPAT to permanently decline by 10%. This expectation seems overly pessimistic for a company that has grown NOPAT by 11% compounded annually over the past 20 years.
If CMI can maintain TTM NOPAT margins of 10% and grow NOPAT by just 5% compounded annually for the next decade, the stock is worth $273/share today – a 59% upside. See the math behind this dynamic DCF scenario.
By utilizing return on capital to identify high-quality companies, HFLGX manages to find undervalued stocks despite classifying itself as a growth fund.
Reliance on Flawed Data Can Hurt Methodology
Despite its ability to find quality, undervalued stocks, HFLGX’s methodology is not perfect. In particular, the fund relies on the S&P Capital IQ Database for its return on capital data. While Capital IQ can be a useful data source, it does not make all the necessary adjustments to rigorously calculate ROIC (nor do any of the major data providers). For more details, this paper compares our ROIC calculation to established data providers.
HFLGX’s reliance on flawed data leads the fund to hold some (not many) low-quality stocks, such as Northrup Grumman (NOC: $324/share).
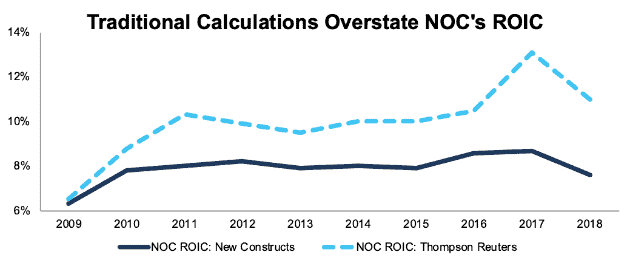
We don’t have access to the Capital IQ Database, but Figure 5 shows that Thompson Reuters, another traditional data provider, significantly overstates NOC’s ROIC. In 2018, Thompson Reuters shows NOC with an 11% ROIC, while our model shows the company with a much lower ROIC of 7.6%.
Figure 5: NOC ROIC: New Constructs vs. Thompson Reuters: 2009-2018

Sources: New Constructs, LLC and company filings
Three main adjustments explain the difference between our calculation and the ones from traditional data providers:
- $440 million (1% of revenue) in non-operating pension gains subtracted from net operating profit after tax (NOPAT)
- $84 million in on-time gains due to tax reform subtracted from NOPAT
- $1.6 billion (5% of reported net assets) in off-balance sheet operating leases added back to invested capital
NOC looks like a highly profitable company through the lens of traditional data providers, but our adjustments show its ROIC is low and declining.
Despite its low ROIC, our reverse discounted cash flow (DCF) model reveals NOC has significant growth expectations embedded in its valuation. In order to justify its price of $324/share, NOC must improve margins from 9% to 10% and grow NOPAT by 7% compounded annually over the next nine years. See the math behind this dynamic DCF scenario. For a company that has grown NOPAT by just 4% compounded annually over the past nine years (a period encompassing the longest economic expansion in US history) this expectation seems overly optimistic.
If NOC can maintain current margins and grow NOPAT by 4% compounded annually over the next nine years, it would be worth $230/share today – a 30% downside. See the math behind this dynamic DCF scenario.
Luckily for investors, NOC appears to be an outlier in what is largely a strong portfolio.
The Importance of Holdings Based Fund Analysis
Smart fund (or ETF) investing means analyzing the holdings of each mutual fund. Failure to do so is a failure to perform proper due diligence. Simply buying a mutual fund or ETF based on past performance does not necessarily lead to outperformance. Only through holdings-based analysis can one determine if a fund’s managers are sticking to their stated methodology and are allocating to high-quality stocks, as HFLGX does.
However, most investors don’t realize they can already get the sophisticated fundamental research that Wall Street insiders use. Our Robo-Analyst technology analyzes the holdings of all 927 ETFs and mutual funds in the All Cap Blend style and 7,500+ ETFs and mutual funds under coverage to avoid what Barron’s calls “the danger within.” The number of holdings in these All Cap Blend ETFs and mutual funds varies from just 4 stocks to 7,946 stocks in a given fund. Our diligence on holdings allows us to cut through the noise and find mutual funds, like HFLGX, with a portfolio and methodology that suggests future performance will be strong.
This article originally published on July 17, 2019.
Disclosure: David Trainer, Kyle Guske II, and Sam McBride receive no compensation to write about any specific stock, style, or theme.
Follow us on Twitter, Facebook, LinkedIn, and StockTwits for real-time alerts on all our research.
[1] This paper compares our analytics on a mega cap company to other major providers. The Appendix details exactly how we stack up.
[2] Harvard Business School features our Robo-Analyst research automation technology in the case New Constructs: Disrupting Fundamental Analysis with Robo-Analysts.
