
Check out this week’s Danger Zone interview with Chuck Jaffe of Money Life.
This online furniture retailer has seen a bump in sales due to COVID-related disruptions, and the stock price has soared. Investors in this firm are betting on a growth story that surpasses Amazon’s even as competition with Amazon and the firms that survived the retail apocalypse only gets tougher. Wayfair, Inc. (W: $314/share) is this week’s Danger Zone pick.
Since we put Wayfair in the Danger Zone in March 2015, the stock is up ~839% (including a 248% gain year-to-date) while the S&P 500 is up just 62%. Investors who think that such extraordinary performance in the stock coincides with accelerating revenue growth, progress towards profitability, or growing competitive advantages are wrong. While Wayfair’s stock performance is attractive to many momentum investors, investors with fiduciary responsibilities should consider the deteriorating fundamentals, weak prospects to achieve profitability, and the unrealistic increase in profits implied by the current valuation.
This report helps investors of all types see just how extreme the risk in W is based on:
- Overstated revenue and earnings from short-term COVID-related bump
- Bigger and profitable competitors
- Doing the math: even Amazon never achieved the revenue and profit growth implied by the current valuation
Growth Won’t Last Forever, but Amazon Will
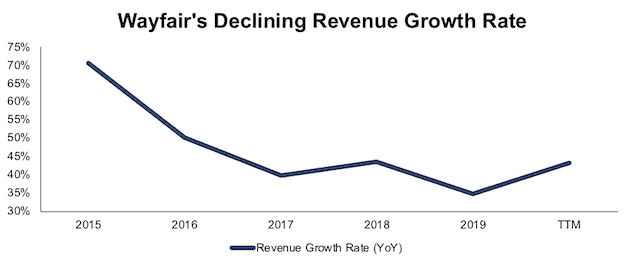
Many investors believe that Wayfair will be the Amazon of the home goods market. However, being “the Amazon” of anything is a tough act to follow, especially considering Wayfair’s growth has been slowing. In four of the past six years, the firm has reported lower YoY growth in revenue. Wayfair grew revenue by 35% YoY in 2019 down from 71% YoY in 2015. While the current economic environment may cause a jump in sales for 2020, we expect the firm’s slowing sales trend to continue long term as demand returns to more normal levels.
Figure 1: Wayfair’s YoY Growth Rate Since 2015
Sources: New Constructs, LLC and company filings.
Amazon’s first mover advantage in online retail was a big driver of its high and sustained revenue growth. It faced very little competition. Amazon reaped the reward of disrupting traditional retail with unexpected and unique skill and speed. On the other hand, Wayfair faces immense competition from Amazon itself, which already has a 30% share of the online furniture market. Wayfair isn’t disrupting anything. Their strategy is similar to the online retail strategy that Amazon and nearly all other retailers now use.
As the original retail disruptor, Amazon enjoyed easy market share gains from the companies it drove into bankruptcy. Wayfair, on the other hand, faces much stiffer competition from the firms who survived Amazon’s disruption and have established successful e-commerce businesses.
One of those survivors is Williams-Sonoma, a Long Idea pick in September 2016 and again in March 2020. Our most recent report noted that Williams-Sonoma’s e-commerce business now generates 57% of the firm’s total revenue. Wayfair not only has to compete with Amazon, and Walmart for that matter (WMT), but also with profitable companies like Williams-Sonoma with successful and growing online operations.
Wayfair Grows Market Share…
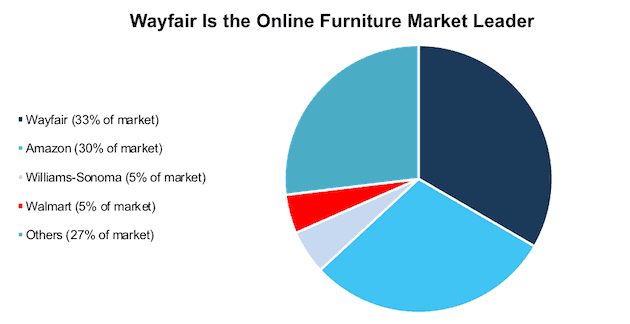
Wayfair’s fast-paced revenue growth has led to the firm’s share of online furniture sales rising from 28% in 2018 to 33% in 2019. However, its increased market share has not come with increased profits. Instead, economic earnings fell from -$559 million to -$1 billion over the same time. On the other hand, many of Wayfair’s competitors have a proven track record of profitability that can sustain their market share.
Figure 2: Wayfair’s Market Share vs. Competitors – 2019
Sources: New Constructs, LLC, and digitalcommerce360.com
… at the Expense of Profitability
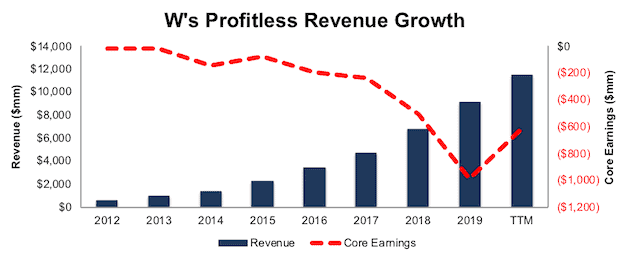
Per Figure 3, Wayfair has grown revenue by 47% compounded annually since 2012. Wayfair’s rapid revenue growth has come with little regard for actual profits. Wayfair’s core earnings[1], have fallen from -$21 million in 2012 to -$613 million over the trailing-twelve-months (TTM).
Figure 3: Wayfair’s Revenue & Core Earnings Since 2012
Sources: New Constructs, LLC, and company filings
And Profitability (or lack thereof) Significantly Lags Peers
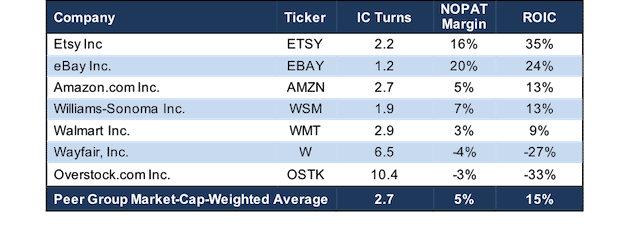
Wayfair’s net operating profit after-tax (NOPAT) margin is negative and has been trending in the wrong direction. Wayfair’s NOPAT margin has fallen from -3% in 2015 to -4% TTM while its peer group’s NOPAT margin has increased from 5% to 6% over the same time.
Peers include Amazon.com Inc. (AMZN), Walmart Inc. (WMT), The Home Depot, Inc. (HD), Lowe’s Companies, Inc. (LOW), Target Corporation (TGT), eBay Inc. (EBAY), Etsy Inc (ETSY), Williams-Sonoma Inc. (WSM), Overstock.com Inc. (OSTK), and ten other housewares and home furnishings companies.
That said, Wayfair’s invested capital turns, a measure of balance sheet efficiency, are superior to its peer group. The firm’s invested capital turns improved from 5.0 in 2015 to 6.5 TTM while its peer group’s invested capital turns have slightly fallen from 2.9 to 2.7 over the same time.
The lack of any brick-and-mortar presence pays off in the form of superior capital efficiency (see Overstock.com’s similarly high invested capital turns), but it does not mean the firm generates or will generate any profits. See Figure 4 for more details.
Figure 4: Wayfair’s Invested Capital Turns, NOPAT Margin, and ROIC vs. Peers
Sources: New Constructs, LLC, and company filings
Wayfair’s superior capital efficiency is not enough to offset its negative margins and drive profits. The firm has never generated positive NOPAT in any year of our model (dates back to 2012) and Wayfair’s return on invested capital (ROIC) fell from -16% in 2015 to -57% in 2019. While TTM ROIC of -27% is an improvement, it is still well below its peers’ market-cap-weighted average TTM ROIC of 15%.
Wayfair Won’t Achieve Economies of Scale Advantage
Usually, the end game for a firm aggressively taking market share while losing money is to achieve economies of scale. Theoretically, a firm with this strategy should be able to cut operating expenses relative to revenue as it gains greater efficiencies.
Unfortunately for Wayfair, it is competing against firms that already boast the largest economies of scale advantages, maybe ever: Amazon and Walmart. Those firms generated a combined TTM revenue of ~$856 billion compared to Wayfair’s $11.5 billion. Wayfair would need to grow its current revenue by over 37 times just to match Amazon and Walmart’s scale and the efficiencies those firms enjoy from the scale they have built over decades.
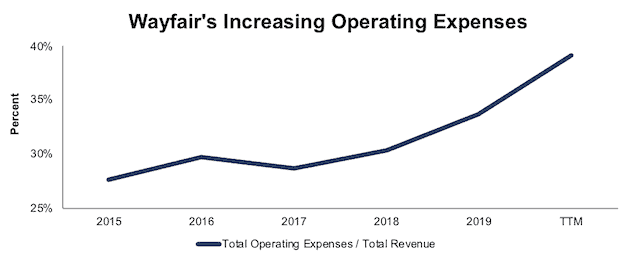
Figure 5 shows Wayfair’s operating expenses as a percent of revenue rose from 28% in 2015 to 39% TTM. For all the talk about the firm’s revenue growth, its operating expenses are growing even faster. Over the past four years, its operating costs have grown 49% compounded annually while its revenue has grown by only 42% compounded annually. In other words, as Wayfair gets bigger, its business grows more costly.
Figure 5: Wayfair’s Operating Expenses as a Percent of Revenue Since 2015
Sources: New Constructs, LLC and company filings.
Don’t Believe Misleading Non-GAAP Metrics
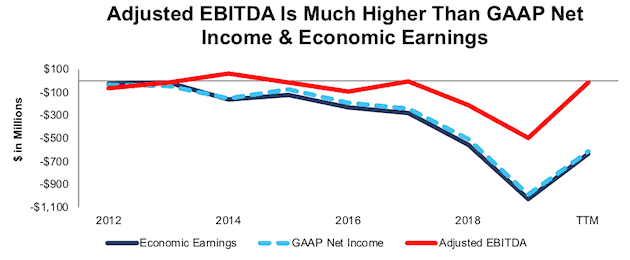
One of the key non-GAAP metrics on which Wayfair’s management focuses is adjusted EBITDA. This contrived metric allows the managers to mask just how much money the firm is losing. Among the items Wayfair excludes when calculating adjusted EBITDA are stock-based compensation expense and depreciation and amortization. By excluding these expenses, the firm shows it is nearing profitability. Per Figure 6, Wayfair’s adjusted EBTIDA has risen from -$497 million in 2019 to just -$12 million TTM, while the firm’s TTM economic earnings are -$640 million.
Figure 6: Wayfair’s Adjusted EBITDA vs. GAAP Net Income & Economic Earnings
Sources: New Constructs, LLC, and company filings
High Cash Burn Dilutes Investors Heavily
While many investors may focus on Wayfair’s cash balance and an adjusted EBITDA approaching breakeven, the firm has a history of significant free cash flow (FCF) burn that is unlikely to change anytime soon. Since 2013, the firm has burned a cumulative $3.5 billion (12% of market cap) in FCF. What’s worse, the firm’s FCF burn is accelerating. Wayfair burned $2.5 billion in FCF in the last three years and $1.6 billion in the TTM period. At the end of 2Q20, Wayfair had $2.4 billion of cash and cash equivalents and has since raised an additional $1.3 billion leaving the firm with $3.7 billion in cash. At its current FCF burn rate, the firm has enough cash to operate for just over 26 months before running out or further diluting its investors.
In fact, investors have seen their ownership cut by more than half over the past several years as shares outstanding increased from 41 million in 2012 to 95 million TTM.
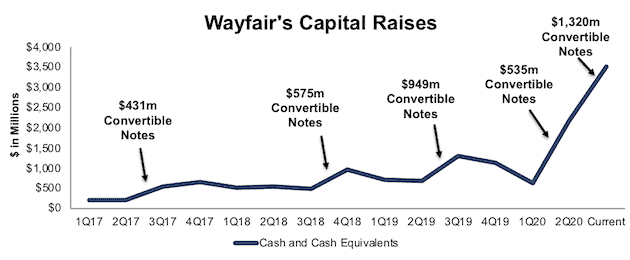
Per Figure 7, over the past 13 quarters, Wayfair has issued convertible notes four times with a cumulative value of $2.5 billion. Before raising more capital in 2Q20, the firm’s cash and cash equivalents had fallen to its lowest level since 3Q18. More debt further dilutes shareholders.
Figure 7: Wayfair’s Cash Levels Sustained by Continually Raising New Capital
Sources: New Constructs, LLC, and company filings
Already Priced to Outpace Amazon’s Growth Trajectory
Despite the deteriorating fundamentals and tougher competition, Wayfair is priced as if it will grow even faster than Amazon once it became profitable.
To justify its current price of ~$314/share, Wayfair must:
- Achieve YoY revenue growth of 84% (equal to 2Q20 YoY increase vs. 2020 consensus of 52%) in 2020 and maintain a 20% compounded annual revenue growth rate each year thereafter (vs. five-year average consensus of 18%)
- Immediately achieve a 2% NOPAT margin (vs. -4% TTM) in 2020 and 2021 and increase NOPAT margin to 4.6% (equal to Amazon’s TTM NOPAT margin) in 2022 and each year thereafter
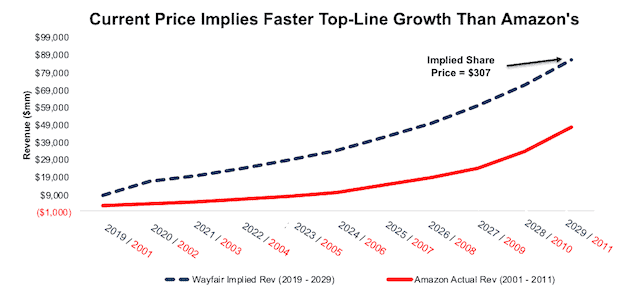
See the math behind this reverse DCF scenario. In this scenario, Wayfair’s revenue in 2029 would reach $86.7 billion, which is greater than Target’s TTM revenue ($80.1 billion), the combined TTM revenue of Lowe’s and eBay ($84.8 billion), and nearly five times the combined TTM revenue of Bed, Bath & Beyond (BBBY), Williams-Sonoma, and Overstock.com (OSTK). Ten years after it first reached profitability, Amazon’s revenue was just $48.1 billion, or 45% below Wayfair’s implied 2029 revenue.
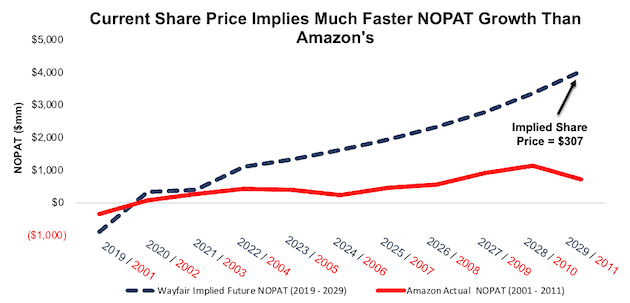
Figure 8 shows the revenue growth expectations baked into the stock price compared to Amazon’s revenue growth from 2001 to 2011. In this scenario, Wayfair will achieve positive NOPAT in 2020 (vs. -$480 million TTM). We chose to compare Wayfair against Amazon’s performance from 2001 to 2011 since this period represents the first ten years of Amazon achieving positive NOPAT.
Figure 8: Current Valuation Implies Unrealistic Revenue Growth
Sources: New Constructs, LLC and company filings.
In this scenario, Wayfair’s NOPAT reaches $4 billion (vs.-$480 million TTM) in 2029 or ~10 years. For comparison, Amazon needed 16 years to generate $4 billion in NOPAT after it first achieved profitability.
Figure 9 compares the firm’s implied future NOPAT in this scenario to Amazon’s actual NOPAT from 2001 to 2011 (Amazon’s first ten years of profitability). This scenario assumes Wayfair will achieve profitability for the first time ever in 2020 like Amazon did in 2002. In any scenario worse than this one, W holds significant downside risk, as we’ll show.
Figure 9: Current Valuation Implies Unrealistic Profit Growth
Sources: New Constructs, LLC and company filings.
Significant Downside Even in the Amazon (Optimistic) Scenario
Even if we assume Wayfair can achieve Amazon’s profitability while aggressively growing revenue, W has significant downside risk. In his scenario, Wayfair must:
- Achieve 10% compounded annual revenue growth
- Immediately achieve a 3% NOPAT margin (equal to Walmart’s TTM margin)
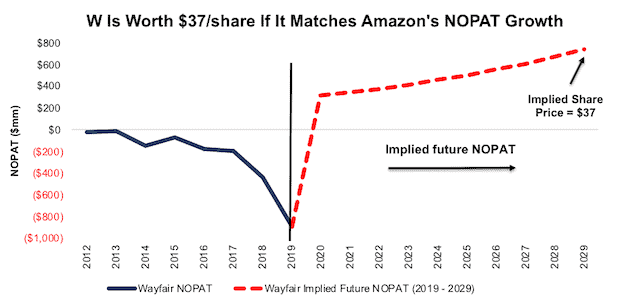
In this scenario, Wayfair grows NOPAT from -$885 million in 2019 to $739 million 10 years from now and the stock is worth just $37/share today – an 88% downside. For comparison, Amazon grew NOPAT from -$348 million in 2001 to $705 million a decade later. In other words, this scenario expects that over the next ten years, Wayfair will achieve nearly the same growth in NOPAT as Amazon.
Figure 10 compares the firm’s implied future NOPAT in this scenario to its historical NOPAT.
Figure 10: Wayfair Has Large Downside Risk: DCF Valuation Scenario
Sources: New Constructs, LLC and company filings.
Acquisition Would Be Unwise
Often the largest risk to any bear thesis is what we call “stupid money risk”, which means an acquirer comes in and pays for Wayfair at the current, or higher, share price despite the stock being overvalued. While there are not many firm’s that would seriously consider acquiring Wayfair, some of the largest competitors in the industry, in theory, could. However, given the highly negative margins and overvalued stock price, we think it would be unwise for a larger firm to acquire Wayfair at current levels.
The likelihood of someone acquiring Wayfair is further reduced by the low barriers to entry in e-commerce. The firm does not have a substantial technological or logistical advantage (rather a marketing/spending advantage) which means other firms can replicate its business model easily and less expensively. Nevertheless, we think it helps to quantify what, if any, acquisition hopes are priced into the stock.
Walking Through the Acquisition Math
First, investors need to know that Wayfair has large liabilities that make it more expensive than the accounting numbers would initially suggest.
- $1.1 billion in operating leases (4% of market cap)
- $13 million in outstanding employee stock options (<1% of market cap)
After adjusting for these liabilities, we can model multiple purchase price scenarios. For this analysis, we chose Walmart (WMT) as a potential acquirer of Wayfair since it has the resources, is investing heavily in its e-commerce business, and has a history of acquiring smaller firms to bolster its own operations. While we chose Walmart, analysts can use just about any company to do the same analysis. The key variables are the weighted average cost of capital (WACC) and ROIC for assessing different hurdle rates for a deal to create value.
Even in the most optimistic of scenarios, Wayfair is worth less than its current share price.
Figures 11 and 12 show what we think Walmart should pay for Wayfair to ensure it does not destroy shareholder value. There are limits on how much Walmart should pay for Wayfair to earn a proper return, given the NOPAT or free cash flows being acquired.
Each implied price is based on a ‘goal ROIC’ assuming different levels of revenue growth. In both scenarios, the estimated revenue growth rate is 52% in year one and 13% in year two, or equal to consensus. In scenario one we then assume revenue grows 20% in year three, 17% in year four and 15% in year five, or equal to consensus. In scenario two, we use 30% growth in years 3,4, and 5 because, to illustrate a best-case scenario, we assume Wayfair could grow revenue faster within the larger distribution network, resources, and customer base of Walmart.
We conservatively assume that Walmart can grow Wayfair’s revenue and NOPAT without spending any working capital or fixed assets beyond the original purchase price. We also assume Wayfair reaches positive margins and achieves a 3% NOPAT margin, which equals Walmart’s TTM NOPAT margin. For reference, Wayfair’s TTM NOPAT margin is -4%.
Figure 11: Implied Acquisition Prices for Value-Neutral Deal

Sources: New Constructs, LLC and company filings
Figure 11 shows the ‘goal ROIC’ for Walmart as its WACC of 3.5%. This scenario represents the minimum level of performance required not to destroy value. Even if Wayfair can grow revenue by 30% compounded annually for five years, the firm is worth less than its current price of $314/share. It’s worth noting that any deal that only achieves a 3.5% ROIC would not be accretive, as the return on the deal would equal Walmart’s WACC.
Figure 12: Implied Acquisition Prices to Create Value
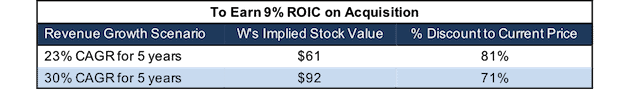
Sources: New Constructs, LLC and company filings
Figure 12 shows the next ‘goal ROIC’ of 9%, which is Walmart’s current ROIC. Acquisitions completed at these prices would be truly accretive to Walmart’s shareholders. Even in the best-case growth scenario, the implied stock price is significantly below Wayfair’s current price. Without a significant increase in margins or revenue growth assumed in this scenario, such an acquisition would result in capital destruction.
Catalyst: Market Can Remain Irrational, But A Slowdown Could Send Shares Lower
Consensus earnings expectations for 2020 and 2021 have soared for Wayfair. According to Zacks, consensus estimates at the end of March pegged Wayfair’s 2020 EPS at -9.77/share. By August 14, consensus estimates jumped all the way to $1.52/share. 2021 estimates follow a similar trend. At the end of March, 2021 EPS consensus was -$8.33/share, but has since increased to $0.26/share.
When the COVID-induced bump to Wayfair’s revenue wears off, the firm could find it very difficult to meet such lofty expectations.
Furthermore, Statista expects the worldwide furniture market to grow by just ~3.5% YoY in 2021. If Wayfair continues to experience extraordinary sales growth this year, the firm will be hard pressed to maintain its high, COVID-driven revenue growth rates which could drive the share price lower.
What Noise Traders Miss With W
These days, fewer investors pay attention to fundamentals and the red flags buried in financial filings. Instead, due to the proliferation of noise traders, the focus tends toward technical trading tends while high-quality fundamental research is overlooked. Here’s a quick summary for noise traders when analyzing W:
- Wayfair’s market share growth has resulted in huge cash losses funded by dilutive share issuances
- Amazon and Walmart continue to have a scale advantages over Wayfair
- Valuation implies Wayfair significantly exceed Amazon’s profit growth
- Wayfair faces much tougher competition than Amazon ever did
Executive Compensation Adds Additional Risk
Given the firm’s history of losses, it comes as no surprise that Wayfair’s executive compensation plan is not directly tied to any measure of profitability.
While four of the firm’s seven executive officers receive annual cash bonuses that can equal up to 25% of their base salaries, the vast majority of executive compensation comes in the form of restricted share unit (RSU) awards. These RSUs vest over a four or five year period and align executives’ interests with the performance of Wayfair’s stock.
We’ve previously covered the problems with aligning executives’ incentives with stock price. Given the firm’s compensation plan, Wayfair’s executives are more likely to focus on top-line growth with no accountability to create true shareholder value.
If Wayfair were concerned about creating shareholder value, then they should use ROIC improvement when determining executive compensation, as there is a strong correlation between improving ROIC and increasing shareholder value. Unfortunately for shareholders, executives are getting compensated while destroying shareholder value. Over the past three years, five of the firm’s seven executives have received RSUs with a cumulative value of $42 million while the firm’s economic earnings fell from -$280 to -$1.0 billion over the same time.
Insider Trading is Minimal and Short Interest Indicates Market Skepticism
Over the past 12 months, insiders have purchased 2.1 million shares and sold 1.8 million shares for a net effect of 259 thousand shares purchased. These purchases represent less than 1% of shares outstanding.
There are currently 16.2 million shares sold short, which equates to 27% of shares outstanding and more than 6 days to cover. The number of shares sold short has declined by 3% since last month. The high short interest indicates many investors are skeptical of Wayfair’s continued growth story and path to profitability.
Critical Details Found in Financial Filings by Our Robo-Analyst Technology
As investors focus more on fundamental research, research automation technology is needed to analyze all the critical financial details in financial filings as shown in the Harvard Business School and MIT Sloan paper, "Core Earnings: New Data and Evidence”.
Below are specifics on the adjustments we make based on Robo-Analyst findings in Wayfair’s 10-Q and 10-K:
Income Statement: we made $105 million of adjustments, with a net effect of removing $102 million in non-operating expenses (1% of revenue). You can see all the adjustments made to Wayfair’s income statement here.
Balance Sheet: we made $109 million of adjustments to calculate invested capital with a net decrease of $109 million. One of the most notable adjustments was $90 million in operating leases. This adjustment represented 7% of reported net assets. You can see all the adjustments made to Wayfair’s balance sheet here.
Valuation: we made $3.1 billion of adjustments with a net effect of decreasing shareholder value by $3.1 billion. There were no adjustments that increased shareholder value. Apart from total debt which includes the operating leases noted above, the most notable adjustment to shareholder value was $13 million in outstanding employee stock options. This adjustment represents <1% of Wayfair’s market cap. See all adjustments to Wayfair’s valuation here.
Unattractive Funds That Hold W
The following funds receive our Unattractive-or-worse rating and allocate significantly to W.
- Global X E-commerce ETF (EBIZ) – 6.5% allocation and Unattractive rating
- Baillie Gifford U.S. Equity Growth Fund (BGGKX) – 5.5% allocation and Unattractive rating
- ProShares Online Retail ETF (ONLN) – 5.0% allocation and Very Unattractive rating
- ProShares Long Online/Short Stores ETF (CLIX) – 4.8% allocation and Very Unattractive rating
- O'Shares Global Internet Giants ETF (OGIG) – 2.6% allocation and Unattractive rating
- Amplify Online Retail ETF (IBUY) – 2.5% allocation and Very Unattractive rating
- SPDR S&P Internet ETF (XWEB) – 2.5% allocation and Very Unattractive rating
This article originally published on August 17, 2020.
Disclosure: David Trainer, Kyle Guske II, and Matt Shuler receive no compensation to write about any specific stock, sector, style, or theme.
Follow us on Twitter, Facebook, LinkedIn, and StockTwits for real-time alerts on all our research.
[1] Our core earnings are a superior measure of profits, as demonstrated in Core Earnings: New Data & Evidence a paper by professors at Harvard Business School (HBS) & MIT Sloan. The paper empirically shows that our data is superior to “Operating Income After Depreciation” and “Income Before Special Items” from Compustat, owned by S&P Global (SPGI).