We closed this position on April 3, 2020. A copy of the associated Position Update report is here.
Check out this week’s Danger Zone interview with Chuck Jaffe of Money Life and Marketwatch.com
When an industry enjoys significant growth, individual stock valuations often rise with the tide. This firm’s inability to grow profits amidst record industry revenues raises a red flag. Add in significant competition, lagging margins, and an overvalued stock price, and it’s hard to justify any bull case. Nevertheless, this stock is up 48% over the past year. For these reasons and more, SunOpta (STKL: $8/share) finds itself in the Danger Zone this week.
Revenue Growth Is Meaningless Without Profits
SunOpta’s economic earnings, the true cash flows of the business, have declined from -$9 million in 2010 to -$26 million in 2015. Economic earnings have fallen further to -$35 million over the last twelve months (TTM). This deterioration in economic earnings comes despite revenue growing 5% compounded annually from 2010-2015, per Figure 1. See a reconciliation of SunOpta’s GAAP net income to economic earnings here.
Figure 1: Economic Earnings Fall As Revenue Rises
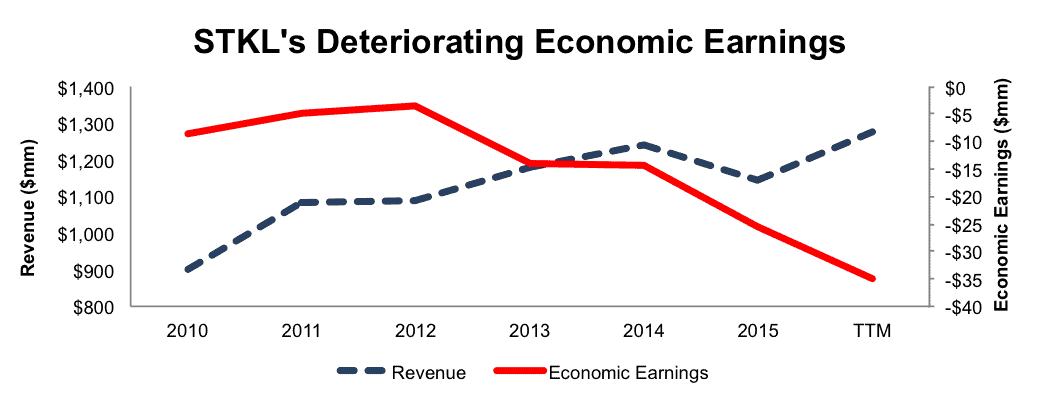
Sources: New Constructs, LLC and company filings
The issues at SunOpta run deeper than just declining economic earnings. SunOpta’s NOPAT margin has nearly halved from 3% in 2010 to 1.6% TTM. Over the past five years, the firm has burned through a cumulative $527 million in free cash flow. Across multiple key metrics, SunOpta’s business is showing significant signs of deterioration.
Destructive Acquisitions Cannot Be Overlooked
SunOpta has built its business on a long string of acquisitions. Since 2010, SunOpta has acquired seven separate companies at a cost of over $546 million. Since 1999, SunOpta has acquired 21 companies. Management touted the importance of the acquisitions to revenue growth and expanding its vertically integrated business model. Due to the high low fallacy, these acquisitions can appear accretive (to EPS) despite the underlying economics being dilutive to shareholders. In fact, more rigorous research reveals these acquisitions did little to earn a quality return on invested capital (ROIC). SunOpta’s ROIC has fallen from 5% in 2010 to a bottom-quintile 2% TTM, per Figure 2. It’s clear SunOpta’s acquisitions have not been as accretive as the company reported.
Figure 2: Acquisitions Lead to ROIC Decline
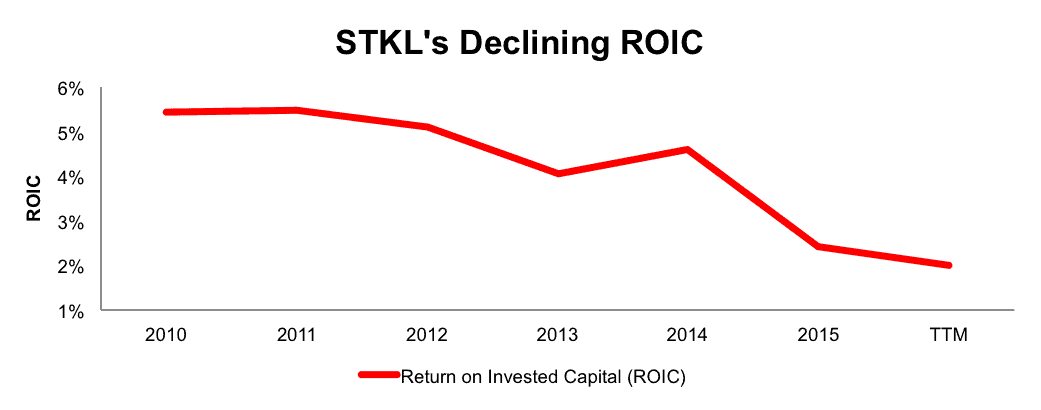
Sources: New Constructs, LLC and company filings
Compensation Plan Uses The Wrong Metrics As Incentives
Misaligned executive compensation plans can line the pockets of executives while costing shareholders. SunOpta’s executive compensation plan includes a base salary, annual bonuses, and long-term incentive awards. The metrics behind the incentive awards do not align executive interests with those of shareholders. In fact, executives could meet the target goals all while destroying shareholder value.
In 2015, annual bonuses were based upon the achievement of net income, return on equity, and return on net assets. 50% of long-term incentive awards were tied to return on net assets. For 2016, annual bonus metrics were changed to EBITDA, consumer product segment gross margin, and leverage ratio. Unfortunately, many of these metrics rely on accounting earnings, which contain many loopholes that can distort reported earnings. At the same time, ROE ignores key off-balance sheet items such as reserves and asset-write downs. For an in depth look at the shortcomings of ROE and why it shouldn’t be used as a pay incentive, click here.
As we’ve demonstrated before, ROIC, not GAAP net income, ROE, gross margin, or other non-GAAP metrics, is the primary driver of shareholder value creation. Without major changes to this compensation plan (e.g. emphasizing ROIC) investors should expect further value destruction.
Non-GAAP Metrics Mask Economic Reality
The SEC is stepping up scrutiny of non-GAAP metrics and rightfully so. Non-GAAP metrics often mask the true economics of a business and make peer comparisons nearly impossible. SunOpta uses the non-GAAP metrics adjusted EBITDA and adjusted earnings to “assist investors in comparing performance across reporting periods.” However, these metrics do little but make the firm look profitable when it is in fact losing money. Below are some of the items STKL removes to calculate its non-GAAP metrics:
- Plant expansion and start up costs
- Downtime, spoilage, and other costs due to equipment failure
- Professional fees related to ongoing litigation
- Costs related to business acquisitions
- Stock based compensation
These adjustments have a significant impact on the disparity between GAAP net income, adjusted earnings, and economic earnings. In 2015, STKL removed over $17 million in costs related to business acquisitions (1% of revenue) to calculate adjusted earnings. When coupled with the adjustments listed above, SunOpta reported 2015 adjusted earnings of $19 million compared to -$22 million GAAP net income and -$26 million economic earnings. Over the last twelve months, SunOpta reported adjusted earnings of $16 million compared to economic earnings of -$35 million, per Figure 3.
Figure 3: Disconnect Between Non-GAAP & Economic Earnings
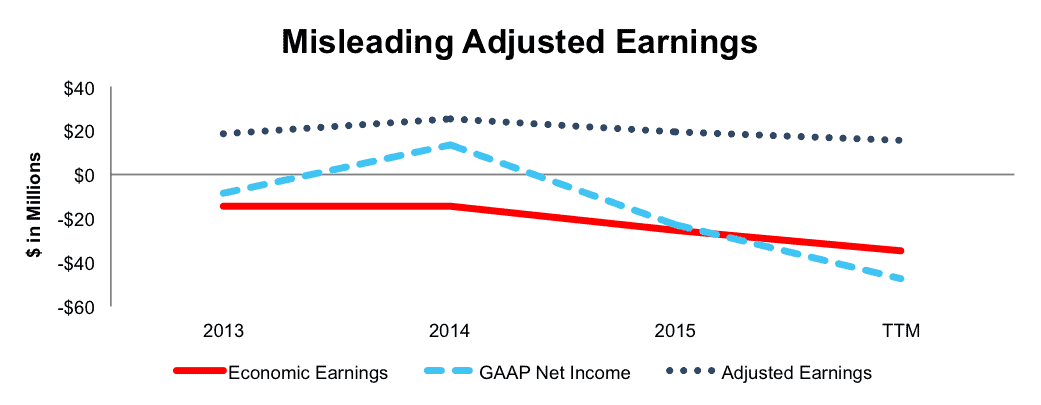
Sources: New Constructs, LLC and company filings
Troublesome Profitability In A Highly Competitive Market
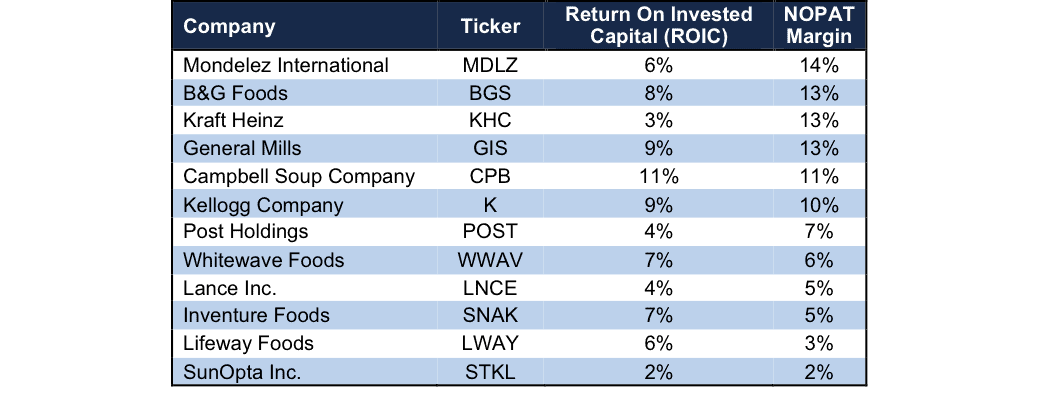
SunOpta operates a “field-to-table” business model in which it sources organic and non-GMO ingredients for retailers and also manufactures its own retail products. This model means many of its competitors are also customers. Regardless of relationship, the market for snack foods & beverages is highly competitive and includes some of the largest food manufacturers in the world. Competitors include Post Holdings (POST), Kraft Heinz (KHC), General Mills (GIS), Whitewave Foods (WWAV), Kellogg Company (K), and Lifeway Foods (LWAY), among others. Per Figure 4 below, SunOpta lags the profitability of its peers.
Most notably, the firms with the highest profitability in the industry are those that have a diversified food portfolio. Firms such General Mills, Kellogg, and Kraft Heinz each have NOPAT margins above 10%. At the same time these firms can act as customers and task SunOpta with ingredient sourcing. The end result of this unique customer/competitor relationship leaves SunOpta with significant competitive disadvantages and minimal pricing power over much larger competitors.
Figure 4: SunOpta’s Lagging Profitability
Sources: New Constructs, LLC and company filings
Bull Hopes Ignore Unprofitability During Organic Boom
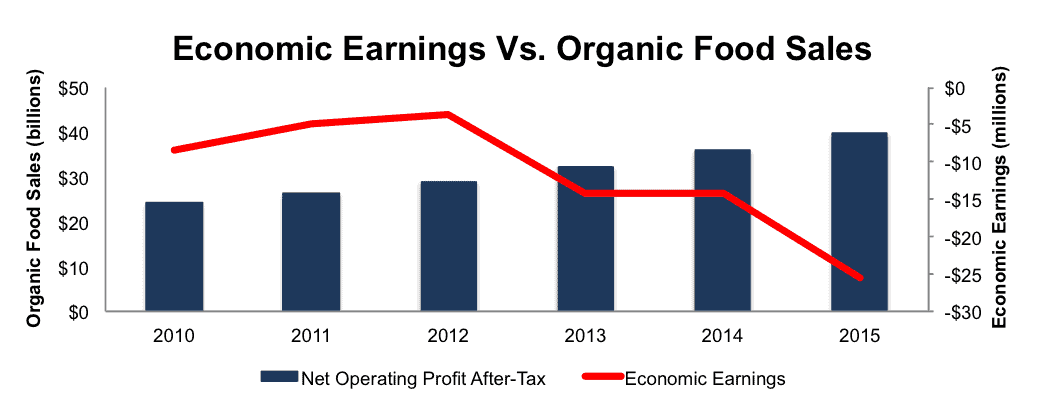
SunOpta bulls will point to the growth in organic food sales as a strong tailwind for the firm. However, this optimism overlooks SunOpta’s inability to earn any profits during this boom time.
Per the Organic Trade Association, organic food sales reached $39.7 billion in 2015, up 11% over the prior year. This sales growth outpaced the 3% growth for the overall food market. Longer-term, organic food sales have risen 11% compounded annually since 2010. Meanwhile, SunOpta’s economic earnings have declined -25% over the same time, per Figure 5.
Figure 5: SunOpta Fails To Take Advantage of Organic Boom
Sources: New Constructs, LLC and company filings.
Adding further pressure to any bull case, SunOpta’s cost of goods sold and selling, general & administrative costs have risen 9% and 11% compounded annually respectively since 2013. SunOpta’s revenue has grown 7% compounded annually over the same time. These rising costs undermine any revenue growth STKL has achieved through acquisition or organically. Costs rising faster than revenue, low margins, and the inability to capitalize on booming organic sales make it hard to believe that STKL will return to profitability anytime soon.
Lastly, any bull case rests on the hope that STKL will not only reverse years of negative economic earnings, but also grow profits at unrealistic growth rates, as we’ll show below.
STKL Is Already Priced For Perfection
Investing in STKL has been a rollercoaster ride. From late 2014 to mid 2016, shares fell nearly 75% while the S&P was up 6%. However, STKL is up 48% over the past year (S&P up 26%) and over 100% since bottoming out in May 2016 (S&P up 11% over same time). This drastic price increase comes despite continued deterioration in business fundamentals.
To justify its current price of $8/share, STKL must achieve NOPAT margins of 4% (highest ever achieved by firm in 2004, compared to 2% TTM) and grow NOPAT by 16% compounded annually for the next 10 years. This expectation seems rather optimistic given that STKL’s NOPAT has declined by 6% compounded annually since 2010.
Even if we assume STKL can achieve 3% NOPAT margins (last achieved in 2012) and grow NOPAT by 13% compounded annually for the next decade, the stock is worth only $5/share today – a 38% downside. Each of these scenarios also assumes STKL is able to grow revenue and NOPAT/free cash flow without spending on working capital or fixed assets. This assumption is unlikely but allows us to create very optimistic scenarios that demonstrate how high expectations in the current valuation are. For reference, STKL’s invested capital has grown on average $93 million (8% of 2015 revenue) per year over the last ten years.
Is STKL Worth Acquiring?
The largest risk to our bear thesis is what we call “stupid money risk”, which means an acquirer comes in and pays for STKL at the current, or higher, share price despite the stock being overvalued. After the company reiterated it was not for sale in June 2016, we only see an acquisition as possible if an acquiring firm is willing to destroy substantial shareholder value.
Below we show just how expensive STKL remains after assuming an acquirer can gain significant synergies.
To begin, STKL has liabilities of which investors may not be aware that make it more expensive than the accounting numbers suggest.
- $105 million in off-balance-sheet operating leases (15% of market cap)
- $54 million in deferred tax liabilities (7% of market cap)
- $7 million in outstanding employee stock options (1% of market cap)
- $3 million in minority interests (<1% of market cap)
After adjusting for these liabilities we can model multiple purchase price scenarios. Even in the most optimistic of scenarios, STKL looks significantly overvalued.
Figures 6 and 7 show what we think Post Holdings (POST) should pay for SunOpta to ensure it does not destroy shareholder value. Post previously acquired organic cereal maker Attune Foods in 2013. Adding SunOpta could immediately strengthen its line of organic snack foods and drinks. However, there are limits on how much POST would pay for STKL to earn a proper return, given the NOPAT of free cash flows being acquired.
Each implied price is based on a ‘goal ROIC’ assuming different levels of revenue growth. In each scenario, the estimated revenue growth rate in year one and two equals the consensus estimate for the current year (22%) and next year (8%). For the subsequent years, we use 8% in scenario one because it represents a continuation of next year’s expectations. We use 10% in scenario two because it assumes a merger with POST could create revenue growth through enhanced distribution platforms and increased marketing efforts.
We conservatively assume that Post can grow SunOpta’s revenue and NOPAT without spending on working capital or fixed assets. We also assume SunOpta immediately achieves a 4% NOPAT margin, which is the highest the firm has ever achieved. For reference, STKL’s TTM NOPAT margin is 2%, so this assumption implies immediate improvement and allows the creation of a truly best case scenario.
Figure 6: Implied Acquisition Prices For POST To Achieve 6% ROIC
 Sources: New Constructs, LLC and company filings.
Figure 6 shows the ‘goal ROIC’ for POST as its weighted average cost of capital (WACC) or 6%. Even if SunOpta can grow revenue by 12% compounded annually with a 4% NOPAT margin for the next five years, the firm is worth less than its current price of $8/share. It’s worth noting that any deal that only achieves a 6% ROIC would be only value neutral and not accretive, as the return on the deal would equal POST’s WACC.
Figure 7: Implied Acquisition Prices For POST To Achieve 9% ROIC
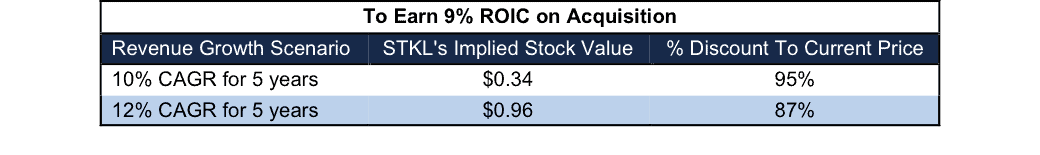 Sources: New Constructs, LLC and company filings.
Figure 7 shows the next ‘goal ROIC’ of 9%, which is the average ROIC of the 44 Food Product companies under coverage and well above POST’s WACC. Acquisitions completed at these prices would be truly accretive to POST shareholders. Even in the best-case growth scenario, the most POST should pay for STKL is $1/share (87% downside). Even assuming this best-case scenario, POST would destroy over $1 billion by purchasing STKL at its current valuation. Any scenario assuming less than 12% CAGR in revenue would result in further capital destruction for POST.
Look for Earnings Weakness To Sink Shares
The recent rally in STKL was spurred when Tourbillon Capital Partners urged SunOpta to explore strategic alternatives to the existing business model. Investors are left holding overvalued firms with little upside when these rallies occur with no change in fundamentals.
As the most recent rally comes to an end, the time to evaluate STKL on its fundamentals returns. As shown above, those fundamentals do not justify the current valuation. Even in the best-case scenarios, the stock could see significant downside pressure. When STKL’s 1Q16 earnings missed EPS estimates, the stock fell 27% over the following 10 days.
Such an earnings miss is no outlier, either. In eight of the past 10 quarters revenue growth has come in below consensus estimates. In five of the past 10 quarters EPS has missed expectations as well. Another earnings miss could be the catalyst needed for the market to re-evaluate STKL. In this case, investors would have to digest that STKL is simply a niche organic provider with poor margins, significant competition, and an uphill battle to begin creating shareholder value.
Insider Action and Short Interest Is Minimal
Over the past 12 months, 229 thousand insider shares have been purchased and 5 thousand have been sold for a net effect of 224 thousand insider shares purchased. These purchases represent less than 1% of shares outstanding. Additionally, there are 1.8 million shares sold short, or 2% of shares outstanding.
Impact of Footnotes Adjustments and Forensic Accounting
In order to derive the true recurring cash flows, an accurate invested capital, and a real shareholder value, we made the following adjustments to SunOpta’s 2015 10-K:
Income Statement: we made $83 million of adjustments with a net effect of removing $41 million in non-operating expense (4% of revenue). We removed $21 million related to non-operating income and $62 million related to non-operating expenses. See all the adjustments made to STKL’s income statement here.
Balance Sheet: we made $945 million of adjustments to calculate invested capital with a net decrease of $58 million. The most notable adjustment was $436 million (52% of reported net assets) related to midyear acquisitions. See all adjustments to STKL’s balance sheet here.
Valuation: we made $714 million of adjustments with a net effect of decreasing shareholder value by $714 million. There were no adjustments that increased shareholder value. The largest adjustment to shareholder value was $651 million in total debt, which includes $105 million in off-balance-sheet operating leases. This lease adjustment represents 17% of STKL’s market cap.
Dangerous Funds That Hold STKL
There are no funds that receive our Dangerous-or-worse rating and allocate significantly to SunOpta Inc.
This article originally published here on February 22, 2017.
Disclosure: David Trainer, Kyle Guske II, and Kyle Martone receive no compensation to write about any specific stock, style, or theme.
Follow us on Twitter, Facebook, LinkedIn, and StockTwits for real-time alerts on all our research.
Scottrade clients get a Free Gold Membership ($588/yr value) as well as 50% discounts and up to 20 free trades ($140 value) for signing up to Platinum, Pro or Unlimited memberships. Login or open your Scottrade account & find us under Quotes & Research/Investor Tools.