
We closed this position on May 17, 2022. A copy of the associated Position Update report is here.
Through our rigorous analysis of Core Earnings and valuation for each of the 11 sectors, we’ve identified the Consumer Cyclicals sector as particularly risky. In 1Q21, the Consumer Cyclicals S&P 500 sector had the third largest year-over-year decline in trailing-twelve-months (TTM) Core Earnings but the third most expensive valuation, as measured by price-to-economic book value (PEBV) ratio (excluding Energy, which has a negative PEBV).
Within the Consumer Cyclicals sector, we identified a mutual fund whose holdings[1] fail to provide investors attractive risk/reward. Fidelity Select Leisure Portfolio (FDLSX) is in the Danger Zone.
Backwards Looking Research Overrates This Fund
Per Figure 1, Fidelity Select Leisure Portfolio earns the 3-Star rating from Morningstar while garnering our Unattractive Predictive Risk/Reward Fund rating. FDLSX also has the worst holdings of all Consumer Cyclicals mutual funds, as highlighted in How to Avoid the Worst Sector Mutual Funds 2Q21.
Figure 1: Fidelity Select Leisure Portfolio Fund Rating
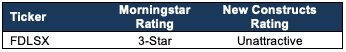
Sources: New Constructs, LLC, company, ETF and mutual fund filings, and Morningstar
FDLSX allocates significantly more capital to companies with low profitability and expensive valuations, which makes its portfolio riskier than its benchmark, State Street Consumer Discretionary Select Sector SPDR Fund (XLY). Investors that rely solely on past performance miss the risk posed by risk this fund’s poor holdings.
Holdings Research Reveals a Low-Quality Portfolio
Per Figure 2, Fidelity Select Leisure Portfolio offers greater downside risk and less upside potential than XLY.
FDLSX allocates 59% of its portfolio to Unattractive-or-worse rated stocks compared to just 36% for XLY. On the flip side, FDLSX’s exposure to Attractive-or-better rated stocks is much lower, at 16%, versus XLY at 31%.
Additionally, nine of FDLSX’s top 10 holdings (58% of assets invested) earn a Neutral-or-worse rating.
Figure 2: FDLSX Allocates Capital to More Low-Quality Holdings
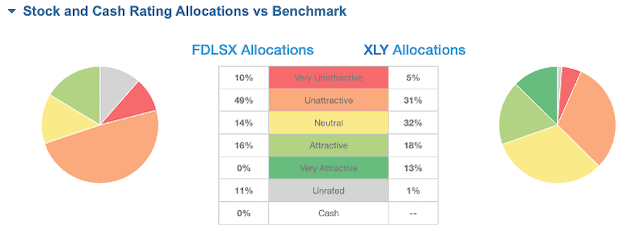
Sources: New Constructs, LLC and company, ETF and mutual fund filings
Given the unfavorable allocation of Attractive-or-better rated stocks vs. Unattractive-or-worse rated stocks relative to the benchmark, FDLSX appears poorly positioned to generate the outperformance required to justify higher fees.
Easily Make Any Fund Better
As we showed in The Paradigm Shift to Self-Directed Portfolio Construction, new technologies enable investors to create their own fund without any fees while also enabling better, more sophisticated weighting methodologies. If instead of weighting by FDLSX’s method, we weight the fund’s holdings by Core Earnings[2], our customized fund allocates:
- 71% of assets to Attractive-or-better rated stocks (compared to 16% for FDLSX)
- 16% of assets to Unattractive-or-worse rated stocks (compared to 59% for FDLSX).
Compare the quality of stock allocation in our customized fund vs. FDLSX here.
Active Management Strategy Needs More Rigor
In its fact sheet, Fidelity Select Leisure Portfolio’s managers claim to pick stocks that:
- have competitive “moats” or secular tailwinds
- are in subindustries where demand is strong and supply growth is constrained
- have either strong cash generation or high-return investment opportunities
Additionally, the managers claim to use a “bottom-up” research methodology that looks for stocks outside the benchmark that offer the potential for favorable risk-adjusted returns.
Unfortunately, these stock-picking criteria are rather subjective and have no direct correlation to shareholder value creation. Why not state that you pick stocks with rising ROICs and/or that you do the diligence in footnotes to ensure you have an accurate measure of profits?
Managers that use subjective or vague language about methodology tend to be less rigorous about how they pick stocks. After all, why wouldn’t managers want everyone to know how much work goes into building a quality portfolio?
Regardless of the level of transparency, without the use of reliable fundamental data and metrics that accurately reflect profitability and valuation (e.g. Core Earnings, return on invested capital [ROIC], and PEBV), FDLSX routinely invests in stocks with low-quality earnings and expensive valuations.
This Fund Holds Less Profitable Companies and Overvalued Stocks
Figure 3 contains our detailed rating for FDLSX, which includes each of the criteria we use to rate all funds under coverage.
These criteria are the same for our Stock Rating Methodology because the performance of a fund’s holdings equals the performance of a fund after fees.
Figure 3: Fidelity Select Leisure Portfolio Rating Details
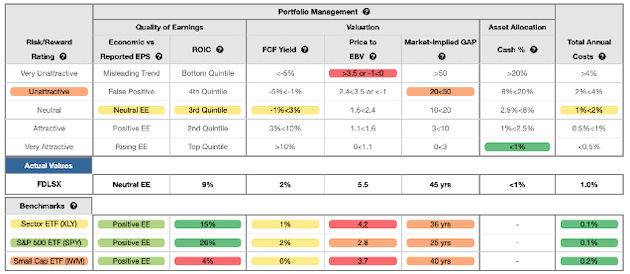
Sources: New Constructs, LLC and company, ETF and mutual fund filings
As Figure 3 shows, FDLSX’s holdings are inferior to its benchmark, XLY, and the S&P 500 (SPY). Specifically:
- FDLSX’s ROIC is 9% and below the 15% earned by XLY and 26% earned by SPY
- the PEBV ratio for FDLSX is 5.5, which is greater than the 4.2 for XLY and 2.8 for SPY
- our discounted cash flow analysis reveals an average market implied growth appreciation period (GAP) of 45 years for FDLSX’s holdings compared to 36 years for XLY and 25 years for SPY
In other words, the stocks held by FDLSX generate inferior cash flows and have higher valuations compared to both XLY and SPY. The market expectations for stocks held by FDLSX imply profit growth (measured by PEBV ratio) that is well above the profit growth expectations embedded in XLY’s and SPY’s holdings.
Lower historical profits and higher expectations for future profits are a bad combination. There is no reason to allocate to overvalued stocks when there are industry leading firms trading at discounted prices.
This Fund Holds Danger Zone Stocks
FDLSX allocates to Danger Zone stocks Uber (UBER) and Airbnb (ABNB), which have dangerously expensive valuations while generating no cash flows. Get our Danger Zone report on ABNB here. See below for details on why we put Uber in the Danger Zone.
We featured Uber in the Danger Zone in March 2021 after naming it one of the most dangerous stocks for fiduciaries in August 2020.
Despite economies reopening, which will undoubtedly help Uber’s top line, the business remains highly unprofitable. Its already slim path to profitability (autonomous driving and/or lower labor costs) isn’t looking any more likely either, just as with peer Lyft (LYFT).
When we look at the true fundamentals of the business, and beyond the top line, economic earnings, which account for unusual items on the income statement and balance sheet, have never been positive and declined from -$4.6 billion in 2017 to -$5.9 billion TTM. Uber has burned through $30 billion (33% of market cap) in free cash flow (FCF) over the past three years, and FCF sits at -$7.8 billion over the TTM period.
Current Price Implies 171% of 2030 TAM: Given the continued lack of profitability, rising driver costs, and falling market share, we think Uber shares remain priced beyond perfection. Below, we use our reverse discounted cash flow (DCF) model to analyze the expectations for future growth in cash flows baked into Uber’s current share price.
To justify its current price of $49/share, Uber must immediately:
- Improve its pre-tax margin to 4% (compared to -41% TTM), which is similar to airlines prior to consolidation and
- grow revenue by 36% compounded annually for the next 10 years.
In this scenario, Uber would earn $241 billion in revenue in 2030. At its 2020 take rate of 19.2%, this scenario equates to over $1.2 trillion in gross bookings in 2030.
In other words, to justify its current stock price, Uber must capture 171% of the combined projected TAM[3] for rideshare and food delivery in 2030. See Figure 4. For reference, Second Measure estimates Uber’s share of the U.S. rideshare TAM is 68% in May 2021 and its share of the U.S. food delivery TAM sits at 25% (when including acquired Postmates) in May 2021.
Figure 4 compares the firm’s implied future gross bookings ($1.2 trillion in 2030) in this scenario to its historical gross bookings, along with the expected TAM for rideshare and food delivery in 2030. For reference, we also include a scenario assuming consensus growth estimates, which we detail below.
Figure 4: Uber’s Historical and Implied Bookings: DCF Valuation Scenarios
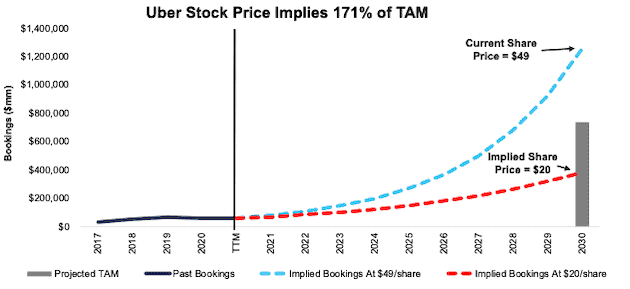
Sources: New Constructs, LLC and company filings.
To further illustrate the unrealistically high expectations baked into Uber’s stock price, we compare the implied revenue from the scenario above to the combined revenue of the four largest U.S. airlines and logistics firms FedEx (FDX) and United Parcel Service (UPS) in Figure 5. Uber’s current stock price implies its revenue ten years from now will be 14% greater than the combined TTM revenue of Delta (DAL), American (AAL), United (UAL), Southwest (LUV), FedEx, and United Parcel Service.
Figure 5: Uber’s Implied Revenue Vs. Travel and Logistics Peers
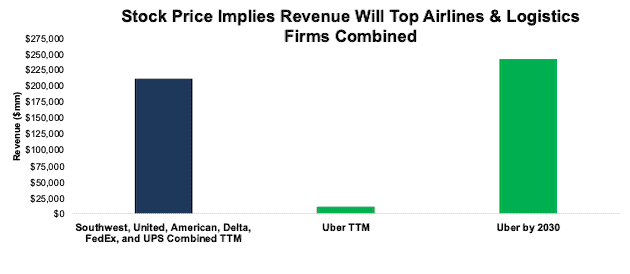
Sources: New Constructs, LLC and company filings.
60% Downside Even if Uber Meets Analyst Estimates: Uber’s economic book value, or no growth value, is negative $45/share, which illustrates the overly optimistic expectations in its stock price.
Even if we assume Uber:
- improves its pre-tax margin to 6% (greater than pre-consolidation airlines) and
- grows revenue by 21% compounded annually (in-line with consensus estimates through 2030) through 2030, then
the stock is worth just $20/share today – a 60% downside. See the math behind this reverse DCF scenario.
Even this scenario seems overly optimistic as it assumes a significant improvement in NOPAT margin and implies Uber’s NOPAT in 2030 would be 113% of American Airlines’ 2019 (pre-Covid-19) NOPAT.
Each of the above scenarios also assumes UBER is able to grow revenue, NOPAT, and FCF without increasing working capital or fixed assets. This assumption is highly unlikely but allows us to create best-case scenarios that demonstrate how high the expectations embedded in the current valuation are. For reference, UBER’s invested capital has increased by an average of $5.8 billion (55% of TTM revenue) over the past three years.
Fees Make Outperformance Even More Difficult
At 1.01%, FDLSX’s total annual costs (TAC) aren’t as outrageous as other mutual funds we’ve put in the Danger Zone, but remain nearly eight times higher than the benchmark ETF, which has total annual costs of 0.13%.
Our TAC metric accounts for more than just the expense ratio. We consider the impact of front-end loads, back-end loads, redemption fees, and transaction costs. For example, FDLSX’s annual turnover ratio of 72% adds 0.15% to its total annual costs –which isn’t captured by the expense ratio. Figure 6 shows our breakdown of FDLSX’s total annual costs, which we provide for all of the ~6,600 mutual funds under coverage.
Figure 6: Fidelity Select Leisure Portfolio Total Annual Costs Breakdown
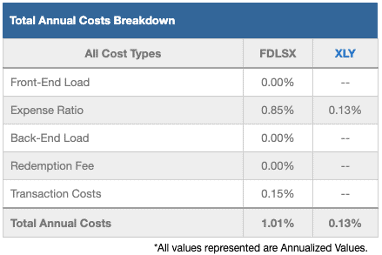
Sources: New Constructs, LLC and company, ETF and mutual fund filings
To justify its higher fees, FDLSX must outperform its benchmark by 0.88% over three years.
FDLSX’s three-year quarter-end average annual total return underperformed XLY by 251 basis points. Its adjusted five-, and ten-year quarter-end average annual total returns have also underperformed XLY by 275 and 354 basis points.
Given that 59% of assets are allocated to stocks with Unattractive-or-worse ratings, FDLSX looks likely to continue to underperform moving forward.
Get a copy of our standard mutual fund report on FDLSX.
The Importance of Holdings-Based Fund Analysis
Smart fund (or ETF) investing means analyzing the holdings of each mutual fund. Failure to do so is a failure to perform proper due diligence. Simply buying a mutual fund or ETF based on past performance does not necessarily lead to outperformance. Similarly, blindly diversifying through index funds is no substitute for diligence. Only through holdings-based analysis can one determine if a fund’s methodology leads managers to pick high-quality or low-quality stocks.
However, most investors don’t realize they can access sophisticated fundamental research[4] using data that enables investors to overcome inaccuracies, omissions, and biases in legacy fundamental datasets. Our Robo-Analyst technology analyzes the holdings of all 33 ETFs and mutual funds in the Consumer Cyclicals sector and ~7,400 ETFs and mutual funds under coverage to avoid “the danger within.” This diligence allows us to cut through the noise and identify potentially dangerous funds that traditional, backward-looking fund research may overlook, such as FDLSX.
Our clients can directly leverage holdings-based analysis and create their own Consumer Cyclicals fund while avoiding the management fees that FDLSX and other mutual funds charge.
Better-Rated Consumer Cyclicals Funds
The following Consumer Cyclicals ETFs and mutual funds earn an Attractive-or-better rating, have more than $100 million in assets under management, and have below average TAC.
- iShares U.S. Home Construction ETF (ITB) – 0.46% TAC
- State Street SPDR S&P Homebuilders ETF (XHB) – 0.39% TAC
- VanEck Vectors Retail ETF (RTH) – 0.39% TAC
- Fidelity Select Communication Services Portfolio (FBMPX) – 0.99% TAC
- First Trust AlphaDEX Consumer Discretionary Fund (FXD) – 0.70% TAC
Check out this week’s Danger Zone interview with Chuck Jaffe of Money Life.
This article originally published on July 12, 2021.
Disclosure: David Trainer, Kyle Guske II, Alex Sword, and Matt Shuler receive no compensation to write about any specific stock, sector, style, or theme.
Follow us on Twitter, Facebook, LinkedIn, and StockTwits for real-time alerts on all our research.
[1] Three independent studies prove the superiority of our data, models, and ratings. Learn more here.
[2] Only Core Earnings enable investors to overcome the flaws in legacy fundamental data and research, as proven in Core Earnings: New Data & Evidence, a paper in The Journal of Financial Economics written by professors at Harvard Business School (HBS) & MIT Sloan.
[3] 2030 TAM estimate equals a $423 billion global ridesharing market and $312 billion global food delivery market. Global ridesharing TAM assumes the global rideshare market continues growing at 19.2% annually from 2026-2030 (consistent with Mordor Intelligence’s estimated CAGR through 2026. Global food delivery TAM assumes the global food delivery market continues growing at 10.9% annually from 2028-2030 (consistent with Research and Market’s estimated CAGR through 2028).
[4] See how our models overcome flaws in Bloomberg and Capital IQ’s (SPGI) analytics in the detailed appendix of this paper.