
We closed this Danger Zone pick on April 9, 2024. A copy of the associated Position Close report is here.
As turbulent equity markets remind investors of the importance of fundamentals, we’ve identified a popular growth stock with fundamentals that cannot justify its high-flying valuation. HubSpot (HUBS: $475/share) is in the Danger Zone.
HubSpot helps businesses streamline their marketing, sales, and service functions through its customer relationship management (CRM) platform. Of course, software platforms to maximize productivity and manage customer relationships are neither new, nor unique. Owning HUBS is extremely risky given the company’s:
- free cash flow (FCF) burning revenue growth
- competition from large incumbents
- commoditized industry
- inferior profitability to peers
- current valuation implies revenue will grow at a 38% CAGR through 2030 and market share will increase over six times the current level
Higher Revenues And Higher Losses
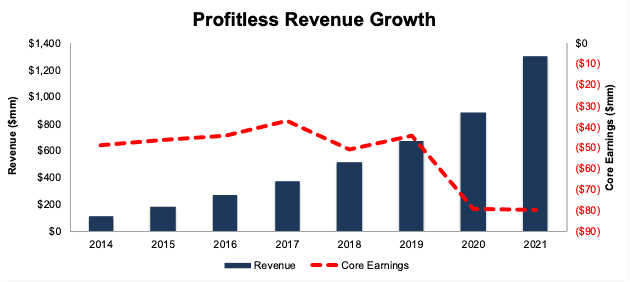
HubSpot’s rapid revenue growth has gained investors’ attention. The company has grown revenue 37% compounded annually since 2016, and management’s guidance for 2022 revenue implies 33% year-over-year (YoY) growth at the midpoint.
However, HubSpot’s fast top-line growth has come with no improvement in the bottom line. Per Figure 1, HubSpot’s Core Earnings have fallen YoY in three of the past four years and from -$49 million in 2014 to -$80 million in 2021.
Figure 1: HubSpot’s Revenue & Core Earnings Since 2014
Sources: New Constructs, LLC and company filings
Top-Line Growth Was Already Slowing
Accelerated adoption of ecommerce and cloud-based solutions drove revenue growth for HubSpot and many similar businesses, such as Squarespace (SQSP) and Shopify (SHOP) to record levels in 2021. However, this record growth glosses over the fact that, prior to 2021, HubSpot’s growth was slowing. In fact, the company’s YoY revenue growth rate slowed each year from 2016 to 2020.
Management has quietly acknowledged 2021 was an outlier year and that revenue growth is likely to slow. The midpoint of management’s guidance implies revenue growth of 33% YoY in 2022, which is well below the 47% YoY growth in 2021 and more in line with the 31% YoY growth in 2020. With rising inflation, the end of ultra-loose Fed policy, and ongoing global supply chain disruptions, the expectations baked into HubSpot’s valuation look unrealistic – especially coming off an outlier year for growth.
Already Low Market Share
As a CRM platform, HubSpot faces competition from much larger companies, as well as smaller, niche offerings. This combination of competitors creates an intensely competitive environment and increasingly commoditized market. In such a market, there are only two types of companies that can create lasting profits:
- Large companies with multiple products/services that offer CRM as an add-on to other offerings that already generate significant cash flows (think Microsoft [MSFT] or Oracle [ORCL])
- The largest and “most scaled” CRM companies that hold more pricing power and an ability to take market share from smaller competitors [think Salesforce.com (CRM)].
HubSpot does not fit into either category. It is a very small player in the global CRM market. Estimates for HubSpot's market share (shown below) vary by source, but one thing is clear, HubSpot’s market share is well below Salesforce.com, which has ~35% market share.
- 1.9% in 2022 by Slintel
- 0.3% in 2022 by Datanyze
- 2.2% in 2021 by Fortune Business Insights
- 1.3% in 2020 by Gartner
Together with Salesforce.com, tech giants SAP (SAP), Oracle (ORCL), Adobe (ADBE), and Microsoft (MSFT) own a combined 61% of the CRM market (per Slintel).
Given its small market share, numerous competitors, and expensive valuation, HubSpot reminds us of another Danger Zone pick, Squarespace (SQSP).
Litany of Competitors Create Additional Obstacle to Profits
The competition is not limited to just the large tech companies listed above. Given that HubSpot offers marketing, sales, and customer support services, its competition is ever growing as there are little barriers to entry in the software-as-a-service industry. Below we list some of the many companies competing with HubSpot across each of its end markets.
- Marketo Engage (owned by Adobe)
- Oracle Eloqua
- Dynamics 365 (owned by Microsoft)
- Salesforce CRM
- SAP CRM
- Zendesk (ZEN)
- Freshworks (FRSH)
- Mailchimp (owned by Intuit [INTU])
- Monday.com (MNDY)
- Klayvio
- Sage CRM
- Freshsales
- Zoho CRM
- SugarCRM
- Agile CRM
- Thryv
- Keap
- Bitrix24
- Copper
- Insightly
- Pipedrive
- Redtail CRM
Given the large list of competitors, HubSpot’s best competitive advantage has been its ability to lose money by spending heavily on sales and marketing while charging low (below costs) prices to attract users.
The bottom line is that charging prices that are too low to generate profits is not a sustainable strategy long-term, especially when the product offered is largely the same as what can be found at any number of other companies. As a verified software review on G2 noted, HubSpot is a “jack of all trades and master of none.” HubSpot’s software is not specialized enough to beat niche products. So, it must compete in the general business productivity software market, which is dominated by larger firms against whom HubSpot has not had success competing to date.
The market is losing patience and punishing unprofitable companies whose main “competitive advantage” is access to large amounts of capital that enables them to outspend competition.
HubSpot Isn’t the Cheapest Option…
Bulls argue that HubSpot is charging lower prices to build market share, and once it has enough market share, it will raise prices and become very profitable. The problem with that argument is that HubSpot isn’t the cheapest option for the segment of the market it targets, which limits its ability to raise prices.
ImpactPlus, which helps companies streamline sales and marketing notes that while HubSpot may be cheaper or comparable to Salesforce’s enterprise solutions, it is likely more costly for small- and medium-sized enterprises than using alternatives like MailChimp and Squarespace. For example, HubSpot’s website builder starts at $23/month for its starter plan, while Squarespace’s base plan starts at $14/month. HubSpot’s marketing tools start at $45/month while MailChimp’s Essentials plan starts at $11/month and its Standard plan starts at $17/month (excludes both companies’ free plans).
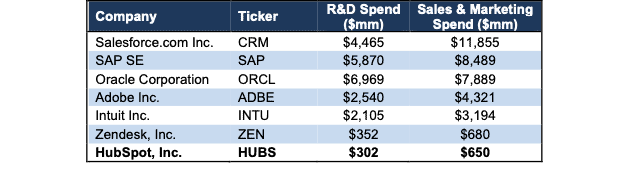
…and Doesn’t Outspend Larger Competitors
HubSpot can’t deploy as much capital, relative to competitors, to develop its product and market its platform. Per Figure 2, HubSpot’s research & development (R&D) and sales & marketing spend in 2021 rank below its largest competitors and even more specialized companies such as Zendesk (ZEN).
With lower spending on R&D, HubSpot risks competitors developing new services/features that its platform cannot match. As noted in the company’s 2021 10-K, “if we are unable to develop new applications that address our customers’ needs, or to enhance and improve our platform in a timely manner, we may not be able to maintain or increase market acceptance of our platform.”
As we’ll show below, HubSpot must drastically increase market share if it has any hope of achieving the expectations baked into its stock price.
Figure 2: HubSpot’s R&D and Sales & Marketing Spend Vs. Peers: TTM
Sources: New Constructs, LLC and company filings
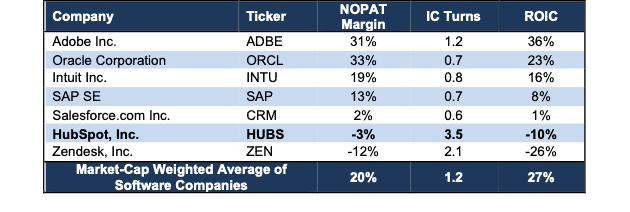
HubSpot Also Has Some of The Worst Margins
Given its lack of market share, intense competition, cash burn and higher prices, HubSpot can’t afford to get into a pricing battle. Per Figure 3, HubSpot’s -10% return on invested capital (ROIC) and -3% net operating profit after-tax (NOPAT) margin are second to last among the publicly traded competitors listed above. The only company with worse profitability than HubSpot is prior Danger Zone pick Zendesk.
Figure 3: HubSpot’s Profitability Vs. Peers: TTM
Sources: New Constructs, LLC and company filings
And Margins Aren’t Expected to Improve
We recommend investors ignore a company’s chosen non-GAAP metrics when analyzing profitability, as they tend to overstate true profits and can be highly misleading. That said, we find some clues as to where margins are headed in management’s guidance for non-GAAP metrics. In 2021, HubSpot’s non-GAAP operating margin reached 9% (compared to -3% NOPAT margin). In 2022, the midpoint of management’s guidance for non-GAAP operating income and revenue implies a 9% non-GAAP operating margin. Management is signaling no improvement to margins in 2022, but HubSpot’s stock is priced for significant improvement in margins, as we’ll show below.
Here's How Misleading Non-GAAP Profitability Is
As with many unprofitable companies, HubSpot uses flawed non-GAAP metrics such as non-GAAP operating income and non-GAAP net income, which paint a rosier picture of the company’s operations. Non-GAAP metrics allow management significant leeway in removing actual costs of the business to present a more optimistic view.
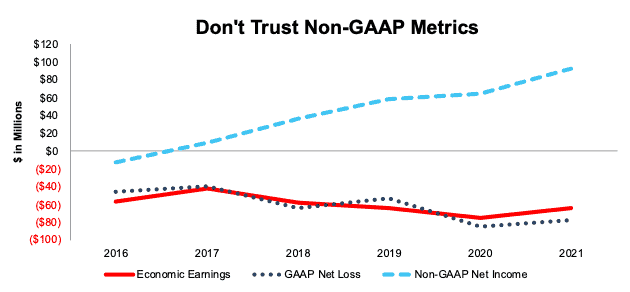
In 2021, HubSpot removed, among other items, $167 million (13% of revenue) in stock-based compensation to calculate its non-GAAP net income. After all of HubSpot’s adjustments, non-GAAP net income in 2021 is $92 million, up from -$13 million in 2016. Economic earnings, which remove unusual gains/losses and changes to the balance sheet, are -$65 million in 2021 and down from -$57 million in 2016. See Figure 4.
Figure 4: HubSpot’s Economic Earnings vs. GAAP and Non-GAAP Net Income: 2016 – 2021
Sources: New Constructs, LLC and company filings
A Growing Cash Bonfire
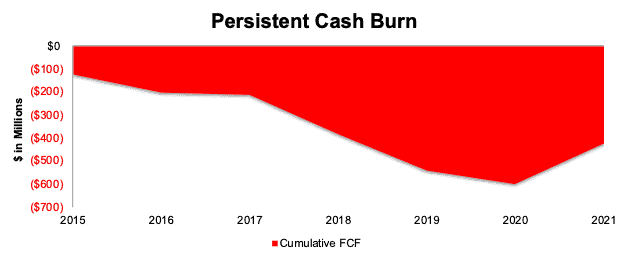
HubSpot’s operating expenses have been greater than 100% of revenue in each of the past six years and the company has also burned through a significant chunk of free cash flow (FCF) over the same time.
The company’s FCF was negative in every year from 2015-2020. Even after generating positive FCF for the first time in 2021 (in what was a standout year for many technology companies), the company’s cumulative FCF since 2015 is -$424 million (2% of market cap).
2021’s positive FCF may turn out to be an outlier as HubSpot looks to expand its presence internationally and incur heavy operating expenses, including research and development, to maintain a product suite on par with competitors.
Figure 5: HubSpot’s Cumulative Free Cash Flow: 2015 – 2021
Sources: New Constructs, LLC and company filings
Stock Price Requires Major Market Share Gains
Driving HubSpot’s growth story is the increased adoption of CRM suites as businesses adapt to an increasingly omni-channel market.
Going forward, the CRM market is expected to grow 13% compounded annually from 2022-2030. While strong, the growth in the global CRM market is nowhere near the revenue growth levels embedded in HubSpot's valuation, as we’ll show below. HubSpot must grow much faster than the overall CRM market, which implies taking significant market share from incumbents, despite lower profitability and smaller scale.
Priced to Be More Profitable Than Salesforce
Below we use our reverse discounted cash flow (DCF) model to analyze the future cash flow expectations baked into HubSpot’s stock price. We also provide two additional scenarios to highlight the downside potential in shares if HubSpot’s revenue grows at more realistic rates.
DCF Scenario 1: to Justify the Current Stock Price.
If we assume HubSpot’s:
- NOPAT margin rises to 8% (more than triple Salesforce’s 2021 [1] NOPAT margin and much higher than HubSpot’s -3% 2021 NOPAT margin) in 2022 through 2030 and
- revenue grows at a 38% CAGR (vs. 2021 – 2023 consensus estimate CAGR of 30%) through 2030, then
the stock is worth $475/share today – equal to the current stock price.
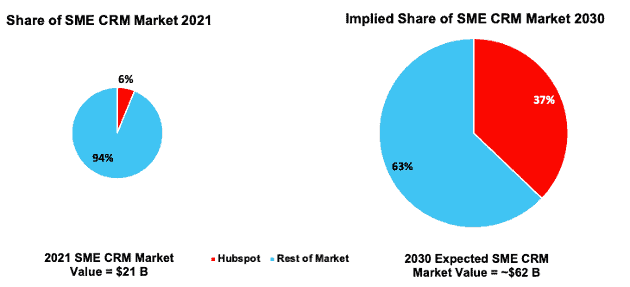
In this scenario, HubSpot generates $22.9 billion in revenue in 2030 or 86% of Salesforce’s 2021 revenue and 145% of Adobe’s 2021 revenue. Per Figure 6, at $22.9 billion, HubSpot’s share of the global small & medium enterprises (SME) CRM market[2] in 2030 would equal 37%, up from 6%[3] in 2021. We look at the implied market share of the global SME CRM market because HubSpot’s focus is on SME, which range from 2 to 2,000 employees.
In this scenario, HubSpot’s NOPAT in 2030 is $1.8 billion, or nearly 3x Salesforce’s 2021 NOPAT. Of course, HubSpot will need to achieve that growth while competing with Salesforce, Microsoft, Oracle and all the other competitors on the list above.
Figure 6: HubSpot’s 2021 Market Share Vs. 2030 Implied Market Share
Sources: New Constructs, LLC, company filings, and Grand View Research
Note that companies that grow revenue by 20%+ compounded annually for such a long period are unbelievably rare. The cash flows expectations in HubSpot’s share price are unrealistically high, which indicates downside risk is much larger than upside potential.
DCF Scenario 2: Shares Are Worth $245 at Consensus Growth
We perform a second DCF scenario to highlight the downside risk to owning HubSpot should it grow at consensus revenue estimates. If we assume HubSpot’s:
- NOPAT margin rises to 8% in 2022 through 2030,
- revenue grows at consensus estimates in 2022 and 2023, and
- revenue grows 27% each year from 2024 through 2030 (continuation of 2023 consensus estimate), then
the stock is worth $245/share today – or 48% below the current stock price. In this scenario, HubSpot generates $11.8 billion in revenue in 2030 or 104% of Intuit’s 2021 revenue and more than triples its market share from 6% in 2021 to 19% in 2030. Additionally, this scenario implies HubSpot generates $947 million in NOPAT in 2030, which is 149% of Salesforce’s 2021 NOPAT, and well above HubSpot’s -$38 million NOPAT in 2021.
DCF Scenario 3: HUBS Has 85%+ Downside
Our last DCF scenario shows the downside risk should HubSpot grow revenue at the consensus expectations for market growth and margins merely double Salesforce’s. If we assume HubSpot’s:
- NOPAT margin rises to 4.8% (double Salesforce’s 2021 NOPAT margin) in 2022 through 2030,
- revenue grows at consensus estimates in 2022 and 2023, and
- revenue grows 13% a year (equal to global CRM market forecast through 2030) from 2024 – 2030, then
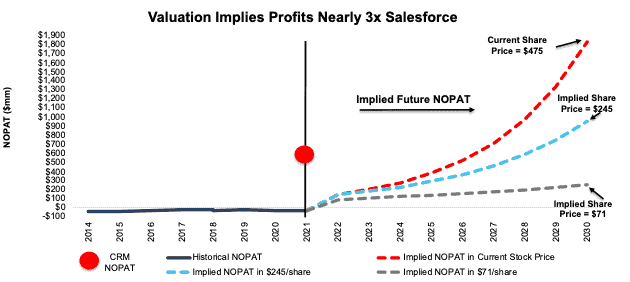
the stock is worth just $71/share today – an 85% downside to the current stock price. This scenario still implies HubSpot increases market share of the global SME CRM market from 6% in 2021 to 8% in 2030 and generates $248 million in NOPAT in 2030, compared to -$38 million NOPAT in 2021.
Figure 7 compares HubSpot’s historical NOPAT to its implied NOPAT in each of the above DCF scenarios. We also include Salesforce’s 2021 NOPAT for comparison.
Figure 7: HubSpot’s Historical and Implied Revenue: DCF Valuation Scenarios
Sources: New Constructs, LLC and company filings
Each of the above scenarios also assumes HubSpot grows revenue, NOPAT, and FCF without increasing working capital or fixed assets. This assumption is highly unlikely but allows us to create best-case scenarios that demonstrate the expectations embedded in the current valuation. For reference, HubSpot’s invested capital has grown 12% compounded annually since 2014. If we assume HubSpot’s invested capital increases at a similar historical rate in DCF scenarios 2-3 above, the downside risk is even larger.
Acquisition Would Be a Destruction of Capital
Often the largest risk to any bear thesis is what we call “stupid money risk”, which means an acquirer comes in and buys HubSpot at the current, or higher, share price despite the stock being overvalued. Given our analysis above, the only plausible justification for HUBS trading at such a high price is the expectation that another company will buy it. Rumors surfaced that Amazon AWS employees had pitched acquiring HubSpot in August 2021, but nothing came of the news and neither company has commented.
We think Amazon will not be interested in buying HubSpot until its valuation comes way down – for all the reasons we presented above. Of course, stranger things have happened than companies getting acquired at foolishly high premiums, so Stupid Money risk always exits. Nevertheless, we think it’s important to quantify how high the acquisition hopes priced into the stock are.
Walking Through the Acquisition Math
First, investors need to know that HubSpot has liabilities that make it more expensive than the accounting numbers would initially suggest:
- $713 million in total debt (3% of market cap)
- $204 million in outstanding employee stock options (1% of market cap).
After adjusting for all liabilities, we can model multiple purchase price scenarios. For this analysis, we chose Amazon as a potential acquirer of HubSpot, but readers can use just about any company to do the same analysis. The key variables are the weighted average cost of capital (WACC) and ROIC for assessing value creation at different hurdle rates.
There are limits on how much Amazon should pay for HubSpot to earn a proper return, given the NOPAT or free cash flows being acquired. Figures 8 and 9 show what we think Amazon should pay for HubSpot to ensure it does not destroy shareholder value. Even in the most optimistic of acquisition scenarios, HubSpot is worth less than its current share price.
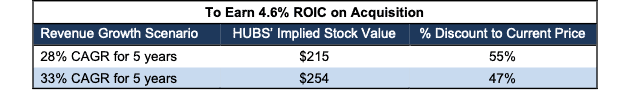
Each implied price is based on a ‘goal ROIC’ and different levels of revenue growth. In Scenario 1, we use 33% revenue growth in Year 1 and 27% in Year 2, which equal consensus estimates. In the first scenario, we extend the 2023 consensus estimate of 27% to years three through five. In the second scenario, we use 33% in years one through five. We use the higher estimates in scenario two to illustrate a best-case scenario that assumes HubSpot grows revenue faster for longer while being integrated within Amazon’s existing business.
We optimistically assume HubSpot achieves a 10% NOPAT margin, which is above its 2021 margin of -3%, and double Amazon’s 2021 margin. We also optimistically assume that Amazon can grow HubSpot’s revenue and NOPAT without spending any working capital or fixed assets beyond the original purchase price, which is unlikely but creates a best-case scenario, nonetheless.
Figure 8: Implied Acquisition Prices for Value-Neutral Deal – Scenario 1
Sources: New Constructs, LLC and company filings
Figure 8 shows the implied values for HubSpot assuming Amazon wants to achieve an ROIC on the acquisition that equals its WACC of 4.6%. This scenario represents the maximum price that can be paid to avoid value destruction. Even if HubSpot can grow revenue by 33% compounded annually for five years and achieve a 10% NOPAT margin, the company is worth just $254/share. It’s worth noting that any deal that only achieves a 4.6% ROIC would not be accretive to value, as the return on the deal would equal Amazon’s WACC.
Figure 9: Implied Acquisition Prices to Create Value – Scenario 2
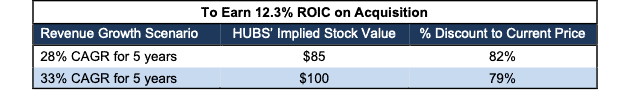
Sources: New Constructs, LLC and company filings
Figure 9 shows the implied values for HubSpot assuming Amazon wants to achieve an ROIC on the acquisition that equals 12%, its current ROIC. Acquisitions completed at these prices would be accretive to Amazon’s shareholders. In this best-case growth scenario, the implied value is far below HubSpot’s current price. Without significant increases in the margin and/or revenue growth assumed in this scenario, an acquisition of HubSpot at its current price destroys significant shareholder value.
Earnings Miss and Expanding Losses Could Send Shares Lower
HubSpot has beat earnings expectations in each of the past 20 quarters. According to Zacks, in both 2020 and 2021, consensus estimates start high and fall throughout the year, which indicates HubSpot is beating a lower bar each consecutive quarter. For instance, in January 2019, consensus estimates for 2020 called for earnings of $1.73/share. At the end of 2019, estimates had fallen to $1.62/share, and at the end of 3Q20, estimates for 2020 earnings had fallen to just $0.95/share. 2021 estimates follow a similar path.
However, 2022 is a different picture. In February 2021, consensus estimates called for earnings of $2.17/share in 2022. As of March 22, 2022, consensus estimates for 2022 earnings have risen to $2.40/share. A miss in this environment, on the back of rising expectations, could send shares tumbling.
Should HubSpot’s 2021 growth prove to be the outlier and revenue growth rates continue their prior downward trend, investors may falter in their belief of this growth story and send shares down to a level more in line with the company’s fundamentals.
What Noise Traders Miss With HUBS
These days, fewer investors pay attention to fundamentals and the red flags buried in financial filings. Instead, due to the proliferation of noise traders, the focus tends toward technical trading trends while high-quality fundamental research is overlooked. Here’s a quick summary for noise traders when analyzing HUBS:
- lack of a moat in a highly competitive industry resulting in minimal market share
- negative margins and miniscule R&D spend relative to competition
- cash-burning operation
- valuation implies the company will be nearly 3x more profitable than Salesforce, the current industry leader
Executive’s Get Compensated While Destroying Shareholder Value
HubSpot’s executives receive annual cash bonuses, which are tied to the achievement of annual recurring revenue and non-GAAP operating income goals. Additionally, executives receive stock options and restricted stock units, neither of which are tied to any performance measure.
By tying executive compensation to metrics that have no correlation to creating shareholder value, HubSpot’s executives have been rewarded while destroying shareholder value. Economic earnings, the true cash flows of the business, have never been positive and declined from -$59 million in 2015 to -$65 million in 2021.
HubSpot should link executive compensation with improving ROIC, which is directly correlated with creating shareholder value, so shareholders’ interests are properly aligned with executives’ interests.
Don’t Buy What Insiders are Selling
Over the past 12 months, insiders have purchased 41 thousand shares and sold 249 thousand shares for a net effect of 208 thousand shares sold. If insiders are selling, why shouldn’t you?
There are currently 2.3 million shares sold short, which equates to 5% of shares outstanding and just under three days to cover. The number of shares sold short has remained flat since last month.
Critical Details Found in Financial Filings by Our Robo-Analyst Technology
Fact: we provide more reliable fundamental data and earnings models – unrivaled in the world.
Proof: Core Earnings: New Data & Evidence, forthcoming in The Journal of Financial Economics.
Below are specifics on the adjustments we make based on Robo-Analyst findings in HubSpot’s 10-K:
Income Statement: we made $75 million of adjustments, with a net effect of removing $35 million in non-operating expenses (3% of revenue). Clients can see all adjustments made to HubSpot’s income statement on the GAAP Reconciliation tab on the Ratings page on our website.
Balance Sheet: we made $1.5 billion of adjustments to calculate invested capital with a net decrease of $1.2 billion. One of the largest adjustments was $1.3 billion in excess cash. This adjustment represented 84% of reported net assets. Clients can see all adjustments made to HubSpot’s balance sheet on the GAAP Reconciliation tab on the Ratings page on our website.
Valuation: we made $2.2 billion of adjustments to shareholder value for a net effect of increasing shareholder value by $391 million. Apart from total debt, one of the most notable adjustments to shareholder value was $204 million in outstanding employee stock options (ESO). This adjustment represents 1% of HubSpot’s market cap. Clients can see all adjustments to HubSpot’s valuation on the GAAP Reconciliation tab on the Ratings page on our website.
Unattractive Funds That Hold HUBS
The following funds receive our Unattractive-or-worse rating and allocate significantly to HUBS:
- Evolutionary Tree Innovators Fund (INVTX, INVNX) – 6.4% allocation and Very Unattractive rating
- T Rowe Price Global Technology Fund (PGTIX, PRGTX) – 6.3% allocation and Unattractive rating
- Artisan Mid Cap Fund (ARTMX, APDMX, APHMX) – 4.4% allocation and Unattractive rating
- Berkshire Focus Fund (BFOCX) – 3.6% allocation and Very Unattractive rating
- American Beacon Bridgeway Large Cap Growth Fund (BLYAX) – 3.1% allocation and Unattractive rating
Check out this week’s Danger Zone interview with Chuck Jaffe of Money Life.
This article originally published on March 28, 2022.
Disclosure: David Trainer, Kyle Guske II, and Matt Shuler receive no compensation to write about any specific stock, style, or theme.
Follow us on Twitter, Facebook, LinkedIn, and StockTwits for real-time alerts on all our research.
[1] We refer to Salesforce’s fiscal year ended January 31, 2022 as 2021.
[2] Grand View Research estimates small and medium enterprises (SME) make up 40% of the global CRM market in 2021. To calculate the implied global SME CRM market size in 2030, we take 40% of the Grand View Research’s projected 2030 global CRM market.
[3] This figure refers to HubSpot’s estimated share of the global SME CRM market, whereas the lower percentages referenced earlier in the report refer to share of the entire (SME and large enterprises) CRM market.