This retailer is positioned well to grow its top and bottom lines over the long term, but the stock is priced as if profits will fall below pre-pandemic levels. Dollar General (DG: $206/share) is this week’s Long Idea.
DG presents quality risk/reward given Dollar General’s:
- largest brick-and-mortar footprint in the U.S.
- rising market share and same-store sales
- small low-cost store format is difficult for competitors to replicate
- high profitability, especially capital turnover, amongst peers
- strong growth opportunities
- current valuation implies profits will fall to pre-2018 levels
Largest Brick-and-Mortar Footprint in the U.S.
With a store within five miles of 75% of the U.S. population, Dollar General offers many millions of consumers convenience and creates strong brand awareness.
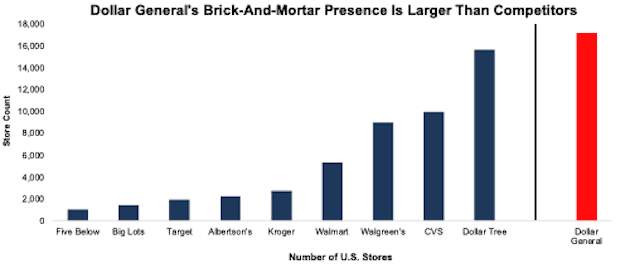
At the end of 2020[1], Dollar General operated 17 thousand stores, more than Dollar Trees’ (DLTR) ~15,700 stores, 1.9X the number of Walgreen’s (WBA) stores, and 1.2x the combined store count of Walmart (WMT), Kroger (KR), Target (TGT), Big Lots (BIG), Five Below (FIVE), and Albertson’s (ACI), per Figure 1.
Figure 1: Dollar General’s U.S. Store Count Vs. Competition - 2020
Sources: New Constructs, LLC and company filings.
Brick-and-Mortar Footprint Is Growing and Taking Market Share
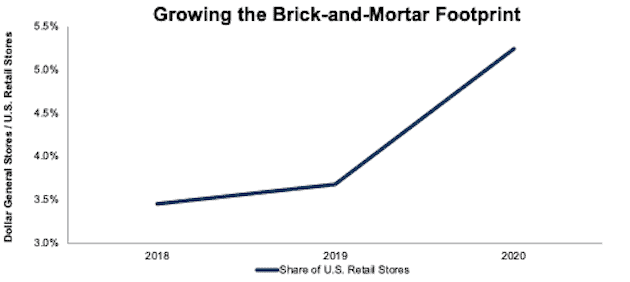
Dollar General is aggressively expanding its footprint. Per Figure 2, Dollar General’s share of U.S. retail stores grew even more during the pandemic as many weaker operators closed stores. Dollar General stores comprised 5.2% of all U.S. brick-and-mortar stores in 2020, up from 3.5% in 2018. The firm plans to add an additional 1,050 stores in 2021.
Figure 2: Dollar General’s Stores as Percent of U.S. Brick-and-Mortar Retail Stores
Sources: New Constructs, LLC and company filings and Statista.
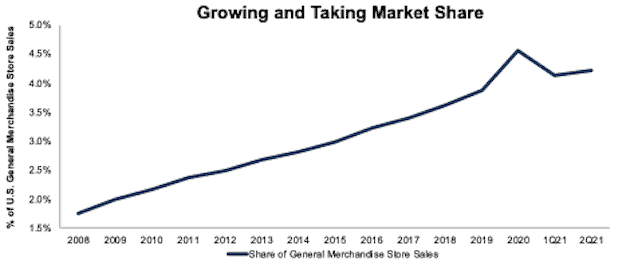
While the Retail Apocalypse led many traditional brick-and-mortar retailers into bankruptcy, Dollar General consistently took market share throughout this time, per Figure 3. The firm’s share of U.S. general merchandise store sales grew from 1.6% in 2007 to 4.6% in 2020. While the firm’s market share fell in 1Q21 to 4.1%, it rebounded in 2Q21 to 4.2% and remains higher than its pre-pandemic share of 3.9% in 2019.
Even Walmart, which operates a very profitable brick-and-mortar business, has seen a decline in its share of U.S. general merchandise store sales, which fell from 52.8% in 2018 to 52.5% in 2020. Walmart’s U.S. physical store sales grew only 2% compounded annually from 2018 to 2020, while Dollar General’s revenue grew 15% compounded annually over the same time.
Figure 3: Dollar General’s Share of General Merchandise Store Sales: 2007 - TTM
Sources: New Constructs, LLC, company filings, and FRED.
More Efficient Operations
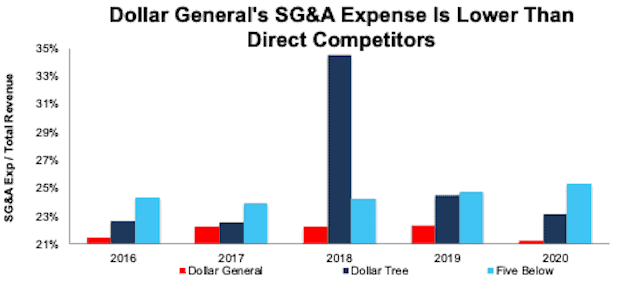
Per Figure 4, Dollar General’s small-box concept store are more efficient than its two closest competitors, Dollar Tree (DLTR) and Five Below (FIVE).
Dollar General’s selling, general, and administrative (SG&A) expense as a percent of total revenue is well below its competitors in each of the past five years.
Figure 4: Dollar General’s SG&A as % of Revenue Vs. Competitors: 2016 - 2020
Sources: New Constructs, LLC and company filings
New Store Growth Is Strong
Following an extraordinary year of record-setting sales is proving hard to repeat, and Dollar-General’s same-store quarterly sales in 2Q21 were down 5% YoY. However, the firm’s total sales, which include new store sales, fared much better and were <1% below 2Q20. Even with difficult total sales comps, management is guiding for sales growth between 0.5% to 1.5% for the full year in 2021 as the firm continues to open new stores. In other words, the firm is not giving up the growth it achieved during the COVID-19 pandemic but is building on a larger base.
The 1,050 new stores opening in 2021 are part of ~17 thousand new store opportunities (double the current footprint) that the firm identified at the end of 2020. Dollar General’s aggressive new store growth plans enable it to take advantage of the large number of retail closures in 2020 and further expand its brick-and-mortar footprint and market presence.
The firm has also developed new store concepts as part of its new-store growth strategy. Dollar Store aims to increase its reach to more middle-class suburban customers through the treasure hunt home-goods oriented PopShelf format and to more urban customers through its convenient-store DGX concept. A successful foray into one or both of these customer segments could provide a long runway for continued new store growth.
Existing Store Network Is Positioned for Future Growth
The firm has grown annual same-store sales in each of the last 31 years. More recently, Dollar General’s same-store sales grew from $20.3 billion in 2016 to $31.9 billion in 2020.
The firm recently brought its distribution of frozen and refrigerated products in house in an effort to reduce costs. This initiative, along with its project to increase cooler spaces in its stores, positions the firm to offer more perishable items, which would create a more “one-stop shop” experience and grow how much customers spend on each store visit.
Dollar General’s vast brick-and-mortar network positions it to expand into other segments of consumer spending, beyond retail. For example, the Centers for Disease Control (CDC) identified Dollar General as a potential distributor of vaccinations to rural communities. The firm recently hired a chief medical officer and is exploring how it can expand its healthcare offering. While it hasn’t announced any formal healthcare plans yet, Dollar General unrivalled brick-and-mortar footprint has the potential to sell more than just retail goods.
Positioned for Digital Growth Too
Dollar General’s extensive small-box store network positions the firm to grow its omni-channel presence as we’ve seen with other best-in-class retailers Best Buy (BBY), Williams-Sonoma (WSM) and Target (TGT).
Dollar General’s digital ecosystem offers customers digital coupons, a shopping list feature, a cart calculator, budgeting tool, and an ecommerce site. Additionally, Dollar General has 4 million active users on its DG Go mobile app, which enables customers to order online and pick up at the store. Dollar General’s limited inventory means online orders are typically only five or six items at a time, are quick for employees to fulfill, and comes at little additional labor cost.
Customers Acquired During COVID Are Likely to Stick
A down economy in 2008/2009 had many people turning to dollar stores, and Dollar General not only took market share, but it also grew at a much faster rate during the Great Recession. From 2008 to 2019, the firm’s revenue grew 9% compounded annually, which is double the YoY revenue growth in 2007.
The firm grew sales 22% YoY from 2019-2020. If the new shoppers acquired during the pandemic stick like those during the Great Recession, Dollar General will be well positioned for continued growth from its larger customer base. To keep those customers, Dollar General launched a retention program in September 2020 and the firm noted in its 2Q21 earnings call that it is, “delighted with what we've seen in terms of the stickiness of the new customers we've brought in, even above expectations”.
Near Term Margins Are Likely to Fall
It’s not all good news for Dollar General, as near-term margins will likely be difficult to maintain. During the pandemic, Dollar General’s revenue received a large boost from competitor’s empty shelves, essential business status, high unemployment rates, and a weakened economy. However, lingering effects of labor shortages, wage increases, supply chain issues, and soaring freight costs are adversely affecting the firm’s gross margins.
Transportation and supply costs in particularly are impacting the firm’s margins. The average world-wide price to ship a container rose more than 4X over the one-year period ended July 1, 2021. These increased transportation and supply costs are making their way to the firm’s bottom line as the firm’s 2Q21 gross margins fell from 32.5% in 2Q20 to 31.6% in 2Q21.
Over the long term, further adoption of technological improvements such as the checkout function from the firm’s DG app and self-checkout capabilities could help relieve some problems from labor shortages and wage increases.
But Dollar General Wins in an Inflationary Environment Over the Long Term
Labor and supply chain challenges are not unique to Dollar General and will likely lead to an inflationary environment. As prices across the retail market rise, Dollar General, as a convenient and low-cost provider, is positioned to gain even more customers in search of relief for their ever-tightening budgets.
A rise in prices for basic consumer prices could help drive sales of Dollar General’s extensive private label products, too, which are typically higher-margin than their branded counterparts.
Given the reach of its physical stores, Dollar General can negotiate pricing from a position of strength with most of its suppliers, which are very motivated to access Dollar General’s distribution network.
Suppliers also know that Dollar General can easily swap out items in its inventory to provide a better value proposition for its customers. Dollar General’s willingness to walk away from many types of items keeps pressure on its suppliers to keep costs low.
Last but not least, Dollar General’s lean operating structure could prove to be an advantage as its higher margins can afford more cost increases than firms with lower margins.
Improved Invested Capital Turns Can Overcome Margin Compression
Concerns over the rise in wages and inventory costs may cause some to doubt Dollar General’s long-term profitability. However, operating efficiency (as measured by NOPAT margin) is just one part of a firm’s profitability. One must also account for balance sheet efficiency (as measured by invested capital turns), where Dollar General excels.
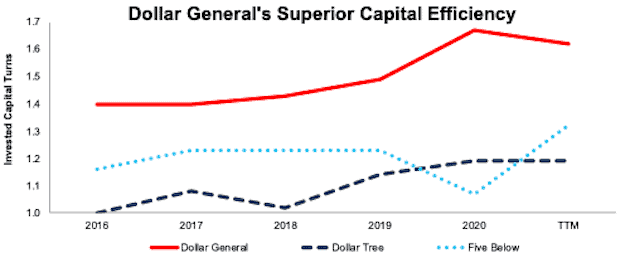
Dollar General’s focus on balance sheet efficiency equips the firm to navigate the challenging margin environment more profitably than its peers. Per Figure 5, the firm’s invested capital turns improved from 1.4 in 2016 to 1.6 over the trailing-twelve-months (TTM). Dollar General’s current invested capital turns of 1.6 are superior to Dollar Tree and Five Below, with invested capital turns of 1.2 and 1.3, respectively.
Furthermore, the Dollar General’s plans to drive more foot traffic to the store with more refrigerated items could help the firm improve its invested capital turns, which would further offset some of the effects of declining margins.
Figure 5: Dollar General’s Invested Capital Turns Vs. Peers: 2016 - TTM
Sources: New Constructs, LLC and company filings
Dollar General’s High Profitability
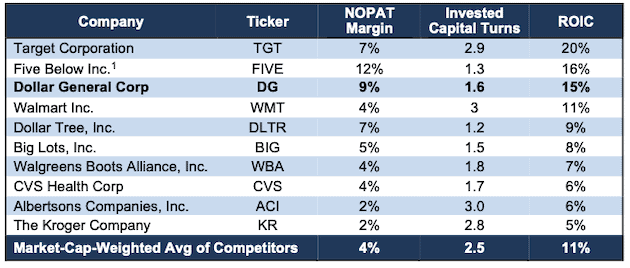
Dollar General’s convenient brick-and-mortar presence and low operating costs produce a very profitable business. Dollar General’s net operating profit after tax (NOPAT) margin improved from 7% in 2016 to 9% TTM. Improved margins and invested capital turns drive Dollar General’s return on invested capital (ROIC) from 7% in 2016 to 15% TTM, which ranks well above larger retailers such as Walmart and Kroger.
Figure 6: Dollar General’s Profitability Vs. Competitors: TTM
Sources: New Constructs, LLC and company filings
Core Earnings Growth Is Likely to Continue Too
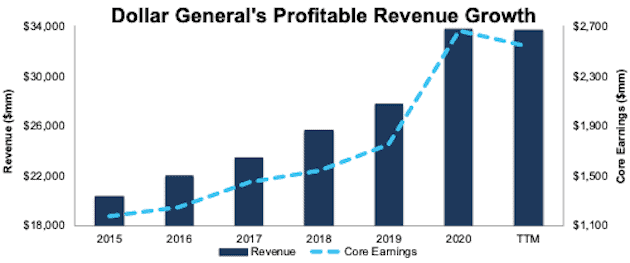
Dollar General’s focus on top-line growth doesn’t mean it is not also focused on the bottom line. Dollar General grew Core Earnings[3] YoY in each of the past 13 years. More recently, the firm grew Core Earnings from $1.2 billion in 2015 to $1.7 billion in 2019. While Core Earnings in the TTM period are below 2020, at $2.5 billion, they remain above 2019 levels.
Figure 7: Dollar General’s Revenue & Core Earnings Since 2016
Sources: New Constructs, LLC and company filings.
DG Is Priced for Profits to Fall to Below Pre-Pandemic Levels
Even though ResearchAndMarkets projects the U.S. retail market to grow 3.5% from 2020 to 2025, Dollar General is priced as if its profits will permanently fall below pre-pandemic levels. We calculate Dollar General’s price-to-economic book value (PEBV) of 0.9 based on its pre-pandemic three-year average NOPAT from 2017-2019. This ratio means the stock is priced for profits to fall 10% below its pre-pandemic profit levels and never recover. This expectation seems overly pessimistic for a firm that took market share in 2020, expanded its profitable brick-and-mortar footprint, and grew NOPAT 12% compounded annually the decade prior to the pandemic.
When we use our reverse discounted cash flow (DCF) model to analyze the future cash flow expectations baked into Dollar General’s stock price, we can provide clear mathematical evidence that the current valuation implies profits will not ever regain 2019 levels. We also provide an additional scenario to highlight the upside potential in shares if Dollar General grows at just half of consensus rates. Each scenario also assumes Dollar General will experience persistently lower NOPAT margins going forward.
DCF Scenario 1: we assume Dollar General’s:
- NOPAT margin falls to 7% (5-year low vs. 9% TTM) in 2021 through 2030 and
- revenue grows just 1% compounded annually from 2021-2030
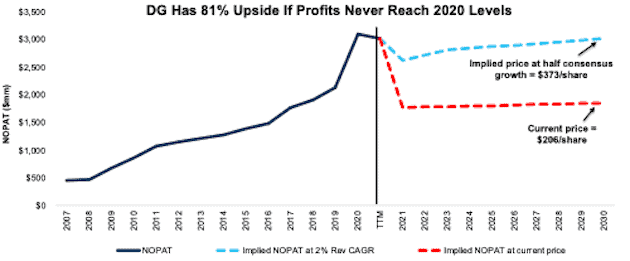
In this scenario, Dollar General’s NOPAT falls 5% compounded annually for the next decade and the stock is worth $206/share today – equal to the current price. In this scenario, Dollar General earns $1.9 billion in NOPAT in 2030, which would be its lowest NOPAT since 2017.
DCF Scenario 2: Shares Are Worth $373+ With Compressed Margins: If we assume Dollar General’s:
- NOPAT margin falls to 8% (vs. 9% TTM) from 2021 through 2030 and
- revenue grows at a 3% CAGR (half of 2021-2023 consensus CAGR) from 2021-2023 and
- revenue grows by 1% each year thereafter through 2030, then
DG is worth $373/share today – an 81% upside to the current price. See the math behind this reverse DCF scenario.
Figure 8 shows Dollar General’s historical NOPAT alongside its implied NOPAT in each of the above DCF scenarios.
Figure 8: Dollar General’s Historical and Implied NOPAT: DCF Valuation Scenarios
Sources: New Constructs, LLC and company filings.
Sustainable Competitive Advantages Will Drive Shareholder Value Creation
Here’s a summary of why we think the moat around Dollar General’s business will enable it to continue to generate higher NOPAT than the current market valuation implies. The following competitive advantages also help Dollar General grow its market share over the long term:
- largest brick-and-mortar footprint in the U.S.
- lower-cost small-store format
- superior invested capital turns compared to peers
What Noise Traders Miss With Dollar General
These days, fewer investors focus on finding quality capital allocators with shareholder friendly corporate governance. Instead, due to the proliferation of noise traders, the focus is on short-term technical trading trends while more reliable fundamental research is overlooked. Here’s a quick summary of what noise traders are missing:
- large market share gains throughout the pandemic
- large omni-channel growth opportunity
- improving operational and balance sheet efficiency
- consistent improvement in YoY profitability before the pandemic
- valuation implies profits will fall to pre-2018 levels
Earnings Beats, Rising Inflation, or Launching Into Healthcare Could Send Shares Higher Long Term
According to Zacks, Dollar General beat EPS estimates in nine of the past 10 quarters and doing so again could send shares higher.
Should a rise in inflation continue, consumers feeling the need to tighten-up their budgets (as they did in the Great Recession) could drive a significant increase in traffic to Dollar General’s stores low-cost offerings.
Lastly, should Dollar General launch into healthcare, investors could take notice that the firm is well-positioned to provide services to an underserved population and sell more than just retail goods.
Dividends and Share Repurchases Could Provide 5.9% Yield
Dollar General has increased its dividend each year since 2015. Since 2016, the firm has paid $1.5 billion in cumulative dividends. The firm’s current dividend, when annualized, provides a 0.8% yield.
Dollar General also returns capital to shareholders through share repurchases. From 2016 to 2020, the firm repurchased $6.2 billion (13% of current market cap) of stock. Dollar General has already repurchased $1.7 billion 1H21 and has $980 million remaining for future repurchases under its current authorization. If the firm repurchases an additional $766 million in shares, which would put 2021 repurchase activity on par with 2020 levels of $2.5 billion, the repurchases would yield 5.1% at Dollar General’s current market cap.
Executive Compensation Plan Is Good, but Could Be Great
No matter the macro environment, investors should look for companies with executive compensation plans that directly align executives’ interests with shareholders’ interests. Quality corporate governance holds executives accountable to shareholders by incentivizing them to allocate capital prudently.
Dollar General compensated executives with salaries, annual bonuses, and long-term equity awards in 2020.
Half of executives’ 2020 performance share units (PSUs) were tied to an adjusted ROIC goal over a three-year performance period. We commend Dollar General for tying performance compensation to improvement in ROIC, as there is a strong correlation between improving ROIC and increasing shareholder value. Tying executive compensation to ROIC also ensures that executives’ interests are actually aligned with shareholders’ interests.
Unfortunately, the other half of executives’ PSUs in 2020 were linked to the non-GAAP metric, Adjusted EBITDA, which shows a much rosier picture of the firm’s operations than GAAP net income or our Core Earnings. The firm achieved an Adjusted EBITDA of $4.2 billion in 2020, or 58% higher than its Core Earnings of $2.7 billion. Tying more compensation to ROIC, and less to adjusted EBITDA, would improve Dollar General’s executive compensation plan.
Dollar General’s focus on ROIC has helped the firm create shareholder value. Dollar General grew economic earnings by 12% compounded annually from 2014 through 2019 (pre-pandemic) and economic earnings over the TTM are 76% above 2019 levels.
Insider Trading and Short Interest Trends
Over the past 12 months, insiders have bought 207 thousand shares and sold 446 thousand shares for a net effect of 239 thousand shares sold. These sells represent less than 1% of shares outstanding.
There are currently 4.4 million shares sold short, which equates to 2% of shares outstanding and 3 days to cover. Short interest is up 13% from the prior month. The lack of short interest reveals not many are willing to take a stake against this market leader loaded with growth potential.
Critical Details Found in Financial Filings by Our Robo-Analyst Technology
Fact: we provide more reliable fundamental data and earnings models – unrivaled in the world.
Proof: Core Earnings: New Data & Evidence, forthcoming in The Journal of Financial Economics.
Below are specifics on the adjustments we make based on Robo-Analyst findings in Dollar General’s 10-K and 10-Qs:
Income Statement: we made $691 million of adjustments, with a net effect of removing $442 million in non-operating expenses (<1% of revenue). You can see all the adjustments made to Dollar General’ income statement here.
Balance Sheet: we made $1.4 billion of adjustments to calculate invested capital with a net decrease of $1 billion. One of the largest adjustments was $286 million in operating leases. This adjustment represented 1% of reported net assets. You can see all the adjustments made to Dollar General’s balance sheet here.
Valuation: we made $14.9 billion of adjustments to shareholder value, all of which decrease shareholder value. Apart from total debt, one of the most notable adjustments to shareholder value was $781 million in deferred tax liabilities. This adjustment represents 2% of Dollar General’s market cap. See all adjustments to Dollar General’s valuation here.
Attractive Funds That Hold DG
The following funds receive our Attractive rating and allocate significantly to DG:
- First Trust NASDAQ Retail ETF (FTXD) – 4.1% allocation
- VanEck Retail ETF (RTH) - 3.5% allocation
- LeaderShares AlphaFactor Tactical Focused ETF (LSAT) – 3.3% allocation
- DWS CROCI U.S. Fund (DCURX) – 2.6% allocation
This article originally published on October 6, 2021.
Disclosure: David Trainer, Kyle Guske II, Alex Sword, and Matt Shuler receive no compensation to write about any specific stock, style, or theme.
Follow us on Twitter, Facebook, LinkedIn, and StockTwits for real-time alerts on all our research.
[1] Dollar General’s last fiscal year ended January 29, 2021, which we refer to throughout the report as 2020.
[2] Five Below’s TTM ROIC is up from 9% in 2020 and may not be sustainable going forward. Five Below’s 2-year average ROIC of 12% is well below Dollar General’s 2-year ROIC of 14%.
[3] Only Core Earnings enable investors to overcome the inaccuracies, omissions and biases in legacy fundamental data and research, as proven in Core Earnings: New Data & Evidence, written by professors at Harvard Business School (HBS) & MIT Sloan and published in The Journal of Financial Economics.

