We’re looking back at two stocks from our “See Through the Dip” series that have significantly outperformed the S&P 500. Our “See Through the Dip” reports feature industry-leading firms that are positioned for even higher profits post COVID-19, but whose stocks traded at historically low valuations.
PVH Corp (PVH: $108/share) remains undervalued and is this week’s Long Idea. And, we are closing a successful Long Idea, Bloomin’ Brands (BLMN: $27/share).
Plenty of Upside Left in PVH Corp
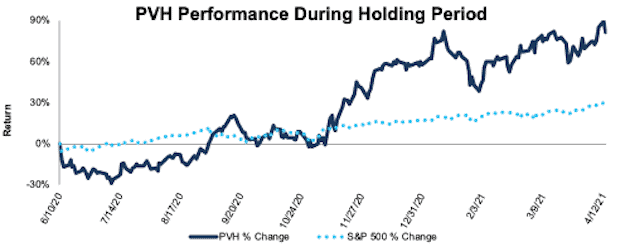
We made PVH Corp a Long Idea on June 10, 2020. Since then, the stock is up 82% while the S&P 500 is up 30%, per Figure 1. At the time, this leading fashion apparel firm had rising profitability, strong historical growth from its core brands, a strong liquidity position, and was trading at a historically low valuation.
Figure 1: Long Idea Performance: From Date of Publication Through 4/13/2021
Sources: New Constructs, LLC
What’s Working: The firm’s ecommerce sales improved 40% year-over-year (YoY) in fiscal 2020 and accounted for nearly 25% of the firm’s fiscal 2020 revenue. In fiscal 4Q20 alone, ecommerce revenue improved 68% year-over-year.
Despite the challenges brought on by global shut downs, PVH Corp managed to reduce its inventory by 12% YoY in fiscal 2020. The firm’s prudent management of inventory levels helped lower invested capital, which drove free cash flow (FCF) higher in a challenging operating environment. PVH Corp generated $790 million in FCF in fiscal 2020, up from $606 million in fiscal 2019. The firm’s strong FCF further shows the strength of the business and managements’ savvy in the face of pandemic disruptions that brought businesses to their knees.
Despite a 42% YoY decline in domestic sales in fiscal 2020, international sales performed much better and only fell 17% YoY. The international segment accounted for 66% of PVH Corp’s fiscal 2020 revenue.
What’s Not Working: The absence of international tourism and bankruptcies at some of its wholesale customers such as J.C. Penney, which was a top 10 customer in fiscal 2019, negatively impacted PVH Corp’s North America business.
Additionally, the rise of WFH drive a the shift in consumer interest to more casual and athletic styles that negatively impacted the firm’s more traditional heritage business (everything except Tommy Hilfiger and Calvin Klein). Heritage business net sales fell 44% YoY and accounted for 12% of the firm’s net sales in fiscal 2020.
Why We’re Still Long PVH: While PVH Corp’s profitability in fiscal 2020 is well below pre-pandemic levels, the decline is in line with the “dip” we anticipated in our “See Through the Dip” thesis.
The firm’s relatively strong international sales occurred even while much of its European retail stores were closed. At the end of fiscal 2020, 50% of the firm’s European stores remained closed. We think this level of disruption is unlikely to persist over the long term which means international sales in fiscal 2021 and beyond could be much higher.
We think that declines in COVID cases since January 2021 and the rapid expansion of vaccinations across the globe will continue to drive a recovery in the firm’s international business and domestic wholesale business. We’re not alone either. Consensus estimates expect revenue to grow upwards of 24% in fiscal 2021 and nearly 6% in fiscal 2022.
The rise of ecommerce across the industry, spurred on by the pandemic, will threaten some brick-and-mortar domestic wholesale customers. However, the risk of PVH Corp permanently losing more wholesale customers is diminished due to its sales channel diversification. No single wholesale customer accounts for 10% of the firm’s fiscal 2020 revenue.
Furthermore, traditional brick-and-mortar stores that survive the “retail apocalypse” and the pandemic are likely to be in stronger positions to purchase more product from PVH Corp as they take market share from bankrupted firms.
While PVH Corp is well positioned to recover profits to pre-pandemic levels, it is priced for permanent profit decline which means the firm still presents excellent risk/reward.
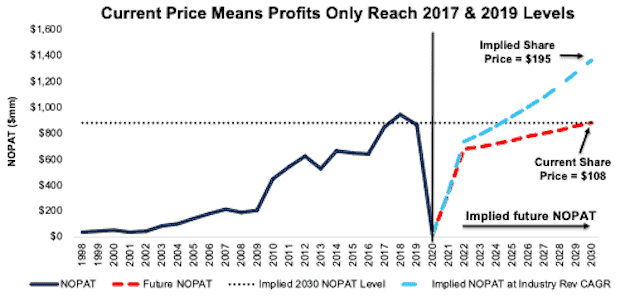
Current Price Means Profits Only Reach Fiscal 2017 & 2019[1] Levels
We use our reverse discounted cash flow (DCF) model to analyze the low expectations for future growth in cash flows baked into the current stock price.
To justify its current price of $108/share, the company must:
- improve its NOPAT margin to 4.5% in fiscal 2021 (vs. 0.3% in fiscal 2020) as the economy begins to recover and to 8.8% (average from fiscal 2015-2019) from fiscal 2022 to fiscal 2030 and
- grow revenue by 3% compounded annually over the next decade (compared to 7% compounded annual growth from fiscal 2011 to fiscal 2019, which represents the period between the first full-year of Tommy Hilfiger sales and the pandemic)
In this scenario, PVH Corp’s NOPAT 10 years from now is only 2% above fiscal 2019 and 5% above fiscal 2017 and the stock is worth $108/share today – equal to the current price. See the math behind this reverse DCF scenario. For further reference, the implied fiscal 2030 NOPAT in this scenario is still 7% below fiscal 2018.
Research and Markets, a market research firm, forecasts the global apparel market to grow from $527 billion in 2020 to $1.1 trillion in 2030. If PVH Corp grows revenue in line with the market forecast over the next ten years, its implied NOPAT in 2030 is $1.4 billion, or 29% above the NOPAT levels the current price implies.
Figure 2: PVH Corp’s Historical and Implied NOPAT: Justification DCF Scenario
Sources: New Constructs, LLC and company filings
Dates represent PVH Corp’s “fiscal year”
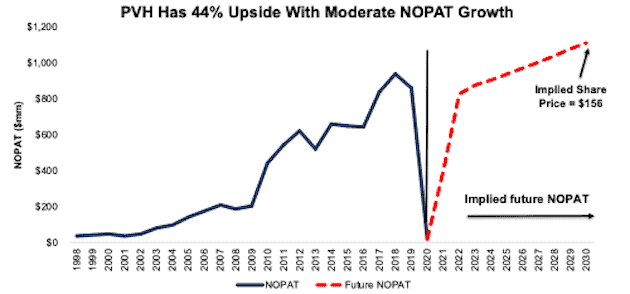
44% Upside at Consensus Growth Estimates: If PVH Corp grows in line with consensus revenue estimates, then the stock has significant upside.
In this scenario, we assume:
- PVH Corp’s NOPAT margin gradually rises to 4.5% in fiscal 2021 (vs. 0.3% in fiscal 2020) and to 8.8% (average from fiscal 2015-2019) from fiscal 2022 to fiscal 2030
- revenue grows 12% (equal to consensus estimates) compounded annually from fiscal 2021 to fiscal 2023 and
- revenue grows at 3.5% (the average annual global GDP growth rate since 1961) each year thereafter through fiscal 2030
In this scenario, PVH Corp’s NOPAT grows just 2% compounded annually from fiscal 2019 to fiscal 2030 and the stock is worth $156/share today – a 44% upside to the current price. See the math behind this reverse DCF scenario.
For reference, PVH Corp grew NOPAT by 6% compounded annually from fiscal 2011 to fiscal 2019. This scenario also implies PVH Corp’s market share of its total addressable market (TAM) falls from 1.5% in 2019 to just 1.1% in 2030.
Figure 3: PVH Corp’s Historical and Implied NOPAT: Valuation DCF Scenario
Sources: New Constructs, LLC and company filings
Dates represent PVH Corp’s “fiscal year”
Time to Take Gains in Bloomin’ Brands
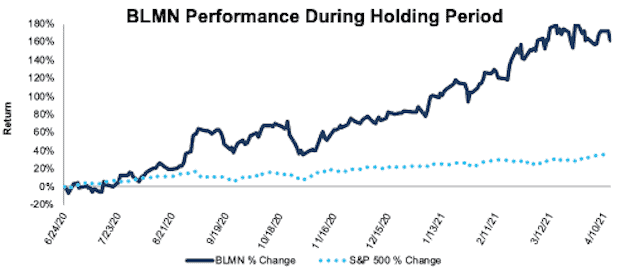
We made Bloomin' Brands Inc. a Long Idea on June 24, 2020. At the time, this restaurant demonstrated promising growth in its off-premise business and its stock was trading at historically low valuations. Since our report, the stock is up 161% compared to 36% for the S&P 500. Figure 4 shows BLMN’s performance vs. the S&P 500.
Figure 4: Long Idea Performance: From Date of Publication Through 4/13/2021
Sources: New Constructs
What’s Worked: The firm’s off-premise sales greatly contributed to its financial strength during the pandemic. Bloomin’ Brands’ off-premise sales increased to 37% of revenue in 4Q20, up from 15% in 4Q19. Building on its off-premise success, Bloomin’ Brands launched a virtual restaurant called Tender Shack which is a delivery-/pick up-only chicken tender concept the firm operates out of its existing restaurant kitchens.
The firm’s sales increased quarter-over-quarter in 3Q20 and 4Q20 and the pace of the sales recovery is accelerating. Through the first seven weeks of 1Q21, Bloomin’ Brands revenue was just 13% below the same period in 2020. For comparison, Bloomin’ Brands’ 4Q20 revenue fell 21% year-over-year.
In 2020, 17% of U.S. restaurants permanently closed, which gave Bloomin’ Brands an opportunity to grow its share of the U.S. total addressable market (TAM) from just 2.7% in 2019 and to 3.4% in 2020.
Why We’re Closing BLMN: While the firm’s profits have not yet fully recovered, the stock price has and is fully pricing in a full recovery. With its off-premise success, the reopening of 99% of its restaurants, vaccinations on the rise, and COVID cases on the decline, the business looks strong and the stock price even stronger. Now, to justify its current price, Bloomin’ Brands must:
- immediately improve NOPAT margin to 6% (all-time high in 2019) and
- grow revenue at consensus estimates (11% CAGR) from 2021 to 2023 and
- grow revenue by 4% compounded annually from 2024 to 2030, which is well above its pre-pandemic revenue CAGR of <1% from 2013-2019 (seven years prior to pandemic). See the math behind this reverse DCF scenario.
In other words, for the stock to have any upside, Bloomin’ Brands must outperform consensus and historical revenue growth all while improving margins to the highest level in company history. We’re taking the gains and closing this long position as the stock no longer provides the same risk/reward.
Make $ Without Meme-Stock Risk
Many investors are taking excessive risk in meme stocks such as GameStop (GME) and AMC Entertainment (AMC). Our “See Through the Dip” portfolio shows that with reliable fundamental research[2], investors can identify stocks with favorable risk/reward. Per Figure 5, the equal weighted portfolio return of the “See Through the Dip” stocks is 63% and the stocks have outperformed the S&P 500 by an average of 28%. Sixteen out of 26 “See Through the Dip” stocks outperformed the S&P 500 since publication of the respective Long Idea.
Figure 5: “See Through the Dip” Stocks vs. S&P 500 – Prices Through April 13, 2020
| Company | Stock Ticker | Publish Date | Return Since Publish Date | Performance vs S&P 500 |
| Bloomin' Brands Inc.* | BLMN* | 6/24/20 | 161%* | 126%* |
| MasTec Inc. | MTZ | 6/10/20 | 137% | 107% |
| General Motors Co. | GM | 7/15/20 | 118% | 89% |
| Southwest Airlines | LUV | 5/4/20 | 129% | 84% |
| D.R. Horton | DHI | 4/27/20 | 121% | 77% |
| Darden Restaurants* | DRI* | 4/22/20 | 107%* | 66%* |
| HCA Healthcare | HCA | 6/22/20 | 92% | 59% |
| PVH Corp | PVH | 6/10/20 | 82% | 52% |
| Caterpillar Inc. | CAT | 5/27/20 | 87% | 51% |
| Hyatt Hotels | H | 5/14/20 | 79% | 34% |
| Simon Property Group | SPG | 4/20/20 | 65% | 32% |
| JPMorgan Chase & Company | JPM | 5/21/20 | 71% | 30% |
| Cracker Barrel Old Country Store | CBRL | 4/29/20 | 71% | 30% |
| SYSCO Corporation | SYY | 4/15/20 | 75% | 26% |
| Intel Corporation | INTC | 8/6/20 | 34% | 11% |
| Universal Health Services, Inc. | UHS | 7/22/20 | 30% | 3% |
| Omnicom Group | OMC | 5/6/20 | 45% | -1% |
| HollyFrontier Corp | HFC | 7/8/20 | 26% | -5% |
| Meritage Homes Corp | MTH | 6/29/20 | 28% | -8% |
| PACCAR Inc. | PCAR | 7/20/20 | 19% | -8% |
| Phillips 66 | PSX | 7/29/20 | 18% | -9% |
| The Hershey Company | HSY | 8/12/20 | 9% | -14% |
| Allison Transmission Holdings | ALSN | 6/15/20 | 16% | -20% |
| Allstate Corp | ALL | 5/18/20 | 20% | -20% |
| John B. Sanfilippo & Son, Inc. | JBSS | 7/13/20 | 4% | -27% |
| Standard Motor Products | SMP | 6/17/20 | 5% | -28% |
| Equal Weighted Portfolio Return | 63% | |||
| Average Outperformance vs S&P 500 | 28% |
Sources: New Constructs, LLC and company filings.
*We are closing BLMN as of this report’s publication date. We closed DRI on March 11, 2021. DRI’s performance is as of March 11, 2021.
This article originally published on April 14, 2021.
Disclosure: David Trainer owns SPG, JPM, H, DHI, LUV, and SYY. Matt Shuler owns HFC. David Trainer, Kyle Guske II, and Matt Shuler receive no compensation to write about any specific stock, sector, style, or theme.
Follow us on Twitter, Facebook, LinkedIn, and StockTwits for real-time alerts on all our research.
[1] All dates in our reverse DCF scenarios for PVH Corp refer to the year in which the firm files it’s 10-K, which may differ from the year PVH Corp uses to describe its fiscal. For instance, in our reverse DCF model, EY 10: 2031 would refer to what PVH Corp would call fiscal 2030.
[2] Only Core Earnings enable investors to overcome the inaccuracies, omissions and biases in legacy fundamental data and research, as proven in Core Earnings: New Data & Evidence, written by professors at Harvard Business School (HBS) & MIT Sloan and forthcoming in The Journal of Financial Economics.


