Fixed Income Metrics
Metrics are only as good as the data that drive them. The best fundamental data in the world drives our metrics. Here’s proof from some of the most respected public & private institutions in the world.
Our company models provide two versions of Fixed Income metrics:
(1) Traditional metrics use unscrubbed accounting data from the firm’s reported financials.
(2) Adjusted metrics use our scrubbed data, which adjusts for 30+ accounting loopholes.
See below for the Fixed Income metrics available in our models and their calculations.
Traditional Metrics
- Debt net of Cash – a liquidity ratio calculated by taking a company’s debt minus its cash.
- Interest Coverage Ratio – a profitability ratio that shows how easily a company can pay their interest.
- Debt to Equity Ratio – a financial leverage ratio that shows how much of a company is funded in debt versus equity.
- Debt to Capital Ratio – a financial leverage ratio that shows how much of a company's capital is funded by debt.
- Debt net of Cash per EBITDA – a leverage ratio that shows how many years it would take a company to pay back its debt if net debt and EBITDA are constant.
- Debt net of Cash Per FCF –a coverage ratio that shows how much debt a company has per free cash flow.
- Current Ratio – a liquidity ratio that measures a company's ability to pay short-term obligations.
- Quick Ratio –a liquidity ratio that measures a company's ability to pay short-term obligations with its most liquid assets.
- Debt Service Coverage Ratio –a measure of cash flow available to pay current debt obligations.
- Asset Turnover Ratio – an efficiency ratio that measures how much revenue a company generates from its assets.
- Fixed Asset Turnover Ratio – an efficiency ratio that measures how much revenue a company generates from its fixed assets.
- Equity Multiplier – a leverage ratio that shows how much of a company's assets are financed by equity.
- Tangible Net Worth – The value of a firm's tangible assets.
- Debt per Tangible Net Worth – a leverage ratio that shows how much a company's tangible assets are financed by debt.
- Basic EPS Growth per EBIT Growth – a ratio that shows that how much earnings per share changes per change in earnings before interest & tax.
- FFO per Total Debt – a leverage ratio for REITs that shows how much free cash flow is available to cover debt obligations.
- FFO per Total Interest Expense – a liquidity ratio for REITs that shows how much free cash flow is available to cover interest expense.
- Asset Coverage Ratio – a solvency ratio that measures how well a company can repay its debt by selling its tangible assets.
- Cash Ratio – a liquidity ratio that measures a company's ability to pay short term obligations with its cash.
See Figure 1 for the formula behind each of these metrics.
Figure 1: Traditional Fixed Income Metric Calculations
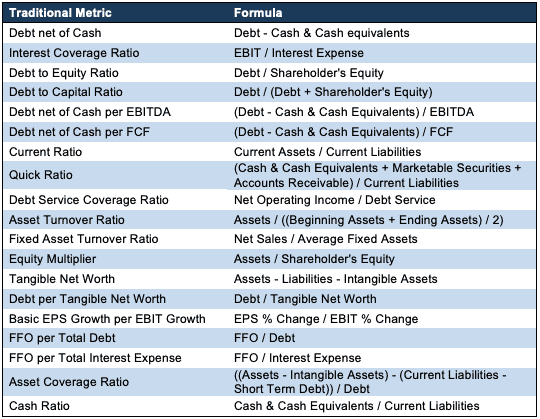
Sources: New Constructs, LLC
Adjusted Metrics
- Debt net of Cash – a liquidity ratio that takes the fair value of a company's debt plus the present value of its operating leases minus its excess cash.
- Interest Coverage Ratio – a profitability ratio that shows how easily a company can pay their non-operating interest.
- Debt to Equity Ratio – a financial leverage ratio that shows how much of a company is funded in debt versus equity. The adjusted version accounts for all debt, including hidden debt such as operating and finance leases.
- Debt to Capital Ratio – a financial leverage ratio that includes all debt that a company has, including hidden debt.
- Debt net of Cash per EBITDA – a leverage ratio that shows how long it would take a company to pay back its debt if net debt and EBITDA are kept constant.
- Debt net of Cash per FCF – a coverage ratio that shows how much debt a company has per the free cash flow it generates.
- Current Ratio – a liquidity ratio that measure's a company's ability to pay back its short-term obligations. Adjusted current assets includes all reserves and required cash.
- Quick Ratio – a liquidity ratio that measures a company's ability to pay short-term obligations with its most liquid assets. Adjusted current assets includes all reserves and required cash.
- Debt Service Coverage Ratio – a coverage ratio that shows how easily a company can pay its debt obligations.
- Asset Turnover Ratio – an efficiency ratio that measures how much revenue a company generates from its assets (a 2-year average).
- Fixed Asset Turnover Ratio – an efficiency ratio that measures how much revenue a company generates from its fixed assets (a 2-year average).
- Equity Multiplier – a leverage ratio that shows how much of a company's assets are financed by equity.
- Tangible Net Worth - The value of a firm's tangible assets.
- Debt per Tangible Net Worth – a leverage ratio that measures how much debt was used to finance a company's tangible assets.
- Basic EPS Growth per EBIT Growth – a ratio that shows how much EPS is affected by change in EBIT.
- FFO per Total Debt – a liquidity ratio for REITs that measures how much free cash flow (FFO) is available to cover its debt obligations.
- Asset Coverage Ratio – a solvency ratio that measures how well a company could repay its debt by selling its assets in a liquidation.
See Figure 2 for the formula behind each of these metrics.
Figure 2: Adjusted Fixed Income Metric Calculations
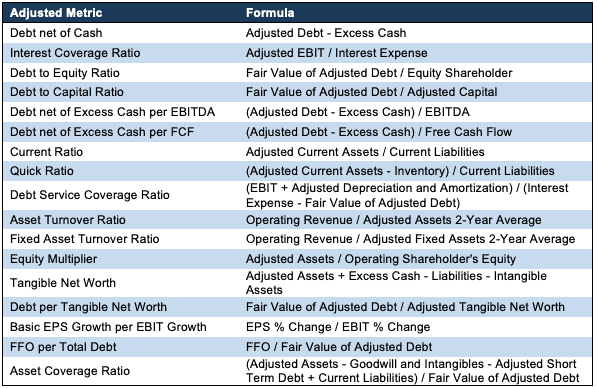
Sources: New Constructs, LLC
Want To Learn More?
Sign up to receive free alerts about all our new research reports including Long Ideas and Danger Zone picks.