Identifying a fund that holds quality companies at cheap valuations is not easy, especially in the meme stock-driven market of late. The American Century STOXX U.S. Quality Value ETF (VALQ) follows a methodology that leads it to allocate heavily to Attractive-or-better rated stocks and is this week’s Long Idea. VALQ is our best All Cap Value style ETF for 1Q21 and ranks first overall among all of our style ETFs in 1Q21[1].
Our Research Looks Forward, Not Backward
VALQ has annualized returns of ~6% over the past three years compared to ~9% for its benchmark, as measured by iShares Core S&P U.S. Value ETF (IUSV). This underperformance drives Morningstar’s backward-looking rating system to rate VALQ below IUSV.
Looking forward instead of backward, we assign VALQ our highest rating: Very Attractive (equivalent to 5 stars). We base our forward-looking Predictive Fund Ratings on in-depth analysis of fund holdings. Relying only on backward-looking ratings could mislead investors into choosing IUSV when more in-depth, holdings-based research shows VALQ has superior risk/reward.
Figure 1: American Century STOXX U.S. Quality Value ETF
Sources: New Constructs, LLC, company filings, and Morningstar
To properly evaluate any ETF, including VALQ, one must analyze the filings, including the footnotes and MD&A, of each of its holdings. This diligence takes an enormous amount of time unavailable to most without the aid of technology. We leverage our Robo-Analyst technology to provide more reliable fundamental data, proven superior by The Journal of Financial Economics.
Holdings Research Reveals a Good Strategy
According to VALQ’s prospectus, the fund seeks to select stocks of large- and mid-cap companies within the STOXX USA 900 Index that are “undervalued or have sustainable income.”
To identify quality companies, the fund uses “measures of profitability, earnings quality, management quality and earnings estimate revisions” to eliminate bottom performers. The fund also looks at “efficient use of capital” to assess management quality. From the remaining group, the fund applies a valuation score based on “value, earnings yield, and cash flow metrics” to find undervalued stocks.
If analyzing stocks based on quality and valuation metrics sounds familiar, it’s because such a strategy is the core of our Value Investing 2.0. We evaluate the quality of all stocks based on economic earnings and return-on-invested capital (ROIC). We also evaluate stocks based on free cash flow (FCF) yield, price-to-economic book value (PEBV) ratio, and growth appreciation period (GAP).
However, having a stated methodology that includes fundamental and valuation screens is not enough to ensure a quality portfolio. We’ve shown before how funds tend to buy the same stocks and managers chasing benchmark returns tend to under allocate to “value” stocks.
Through a detailed analysis of VALQ’s holdings, which leverages our more reliable fundamental data, we find that this fund’s strategy does help management pick superior holdings to its benchmark.
Figure 2: VALQ Allocates Capital to Superior Holdings
Sources: New Constructs, LLC and company filings
Per Figure 2, VALQ allocates 56% of its assets to Attractive-or-better rated stocks compared to just 35% for IUSV. On the flip side, VALQ allocates just 7% of its assets to Unattractive-or-worse rated stocks compared to 28% for IUSV.
Given this favorable allocation relative to the benchmark, VALQ appears well-positioned to capture more upside with lower risk. Compared to the average ETF, VALQ has a much better chance of generating the outperformance required to justify its already minimal fees.
VALQ Finds Quality Stocks at Cheap Valuations
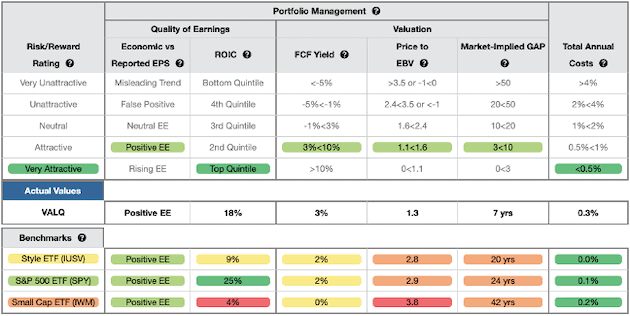
Figure 3 contains our detailed rating for VALQ, which includes each of the criteria we use to rate all ETFs under coverage. These criteria are the same for our Stock Rating Methodology, because the performance of an ETF’s holdings equals the performance of the ETF after fees.
Figure 3: American Century STOXX U.S. Quality Value ETF (VALQ) Rating Breakdown
Sources: New Constructs, LLC and company filings
VALQ’s holdings are superior to IUSV in four out of five categories and beat State Street SPDR S&P 500 ETF Trust (SPY) in three out of five. Our holdings research reveals that VALQ’s’:
- positive economic earnings match IUSV and SPY.
- ROIC of 18% is double IUSV.
- free cash flow yield of 3% is higher than the 2% FCF yield for IUSV and SPY.
- PEBV ratio of 1.3 is well below IUSV’s PEBV ratio of 2.8 and SPY’s of 2.9.
- growth appreciation period (GAP) of seven years is much lower than the GAP of 20 years for IUSV and 24 years for SPY.
In other words, VALQ’s holdings generate quality cash flows and have cheaper valuations compared to IUSV and SPY. The market expectations for stocks held by VALQ imply profits will only grow by 30% (measured by PEBV ratio) while the expectations embedded in IUSV’s and SPY’s holdings imply a near tripling of profits. High historical profits and relatively low expectations for future profits are an attractive combination.
Given its focus on quality and valuation, it’s no wonder that 24% of the ETF’s assets (35 stocks in total) are allocated to stocks we’ve featured as Long Ideas (See Appendix for details).
Investors Could Have a Portfolio With an Even Better Allocation
Despite allocating more to Attractive-or-better rated holdings than its benchmark, investors could easily improve this allocation themselves. As we showed in The Paradigm Shift to Self-Directed Portfolio Construction, new technologies enable investors to create their own fund without any fees while also enabling better, more sophisticated weighting methodologies. If instead of weighting by VALQ’s method, we weight the fund’s holdings by economic earnings, the true cash flows of a business, our customized fund allocates:
- 66% of assets to Attractive-or-better rated stocks (compared to 56% for VALQ)
- less than 1% of assets to Unattractive-or-worse rated stocks compared to 7% for VALQ.
See a detailed view of the quality of stock allocations in our customized fund vs. VALQ’s actual allocation here. Luckily for investors willing to pay for the convenience of having a portfolio managed for them, VALQ’s costs are manageable, as we’ll show below.
VALQ’s Costs Are Reasonable
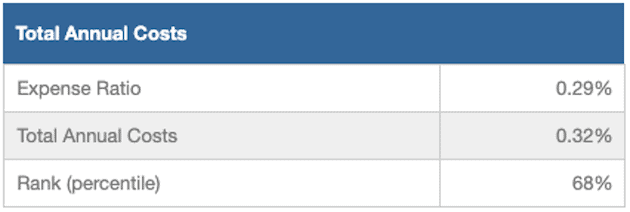
VALQ’s 0.32% total annual costs (TAC) are below the average of the 50 All Cap Value style ETFs under coverage of 0.36% but slightly above the weighted average of 0.27%. However, VALQ justifies its costs by executing an investment strategy that earns an Attractive Portfolio Management Rating.
Figure 4 shows our breakdown of VALQ’s total annual costs, which is available for all of the nearly 7,000 mutual funds and 700+ ETFs under coverage.
Figure 4: VALQ’s Annual Costs
Sources: New Constructs, LLC and company filings
A Closer Look at a Quality Holding
Intel Corporation (INTC: $64/share) is one of VALQ’s quality holdings and a stock we made a Long Idea in August 2020 as part of our “See Through the Dip” thesis. Since then, INTC is up 31% versus 19% for the S&P 500. While the stock has outperformed the market, it still offers ample upside potential.
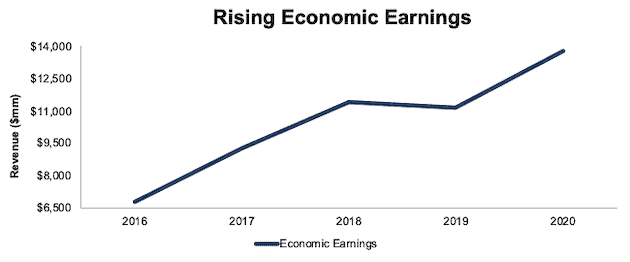
Since 2016, the firm has grown net operating profit after tax (NOPAT) by 15% compounded annually. The firm’s NOPAT margin rose from 20% in 2016 to 26% in 2020 while its ROIC rose from 15% to 18% over the same time. Per Figure 5, the firm’s economic earnings have grown from $6.8 billion in 2016 to $13.8 billion in 2020.
Figure 5: Intel’s Economic Earnings Since 2016
Sources: New Constructs, LLC and company filings
The Market Expects Intel’s Profits to Decline 34% Below 2020 Levels
At its current price of $64/share, INTC trades at a PEBV ratio of 0.7. This ratio means the market expects Intel’s NOPAT to permanently decline by 30%. This expectation seems overly pessimistic over the long term given the firm has grown NOPAT by 6% compounded annually over the past decade and 7% compounded annually over the past two decades.
Intel’s current economic book value, or no-growth value, is $86/share – a 34% upside to the current price.
Below, we use our reverse discounted cash flow (DCF) model to show the growth expectations baked into Intel’s current stock price. Intel’s current valuation implies its:
- NOPAT margin falls to 25% (five-year average vs. 26% TTM) and
- revenue falls 4% compounded annually for the next decade, which assumes a 6% decline in 2021 (equal to consensus estimate) and a 3.3% decline each year thereafter (vs. consensus estimates of -0.1% in 2022 and +2.1% in 2023).
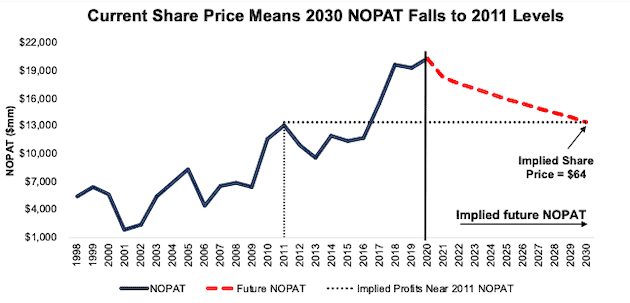
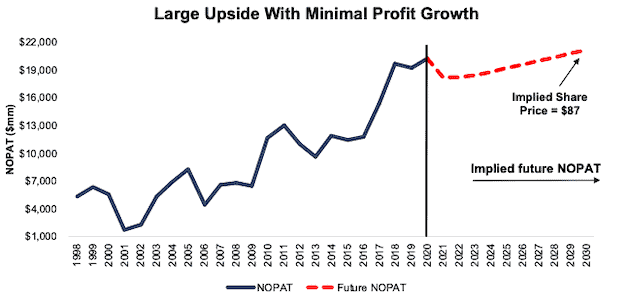
In this scenario, Intel’s NOPAT falls 4% compounded annually and is just $13.4 billion in 2030, or 34% below its 2020 NOPAT. See the math behind this reverse DCF scenario. Figure 6 compares Intel’s implied future NOPAT in this scenario with its historical NOPAT.
Figure 6: Current Price Implies a Permanent Decline in NOPAT
Sources: New Constructs, LLC and company filings
36% Upside If Intel Grows Profits by <1%
Our analysis reveals INTC holds significant upside potential even if it grows NOPAT by less than 1% compounded annually. If we assume Intel’s:
- NOPAT margin falls to 25% (five-year average vs. 26% TTM) and
- revenue grows by 1% compounded annually for the next decade, which assumes a 1.7% compounded annual decline from 2021 to 2023 (equal to consensus estimates) and growth of just 2% each year thereafter, which is below the average global GDP growth rate of 3.5% since 1961, then
the stock is worth $87/share today – a 36% upside to the current stock price. See the math behind this reverse DCF scenario. Figure 7 compares Intel’s implied future NOPAT in this scenario with its historical NOPAT.
Figure 7: INTC Holds 36% Upside If 2030 Profits Are Just 5% Above 2020 Levels
Sources: New Constructs, LLC and company filings
Even Quality ETFs Can Have Some Bad Holdings
Despite a good methodology and allocating most of its assets to Attractive-or-better rated stocks, not every VALQ holding offers quality risk/reward. Dentsply Sirona, Inc. (XRAY: $64/share) is one such low-quality holding.
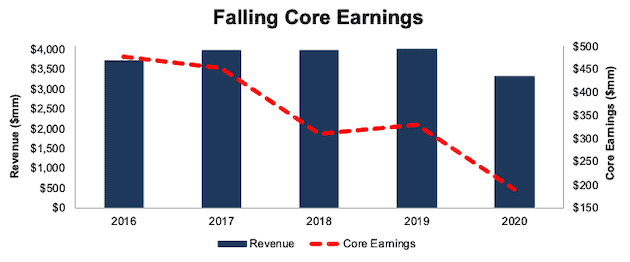
Since acquiring Sirona Dental in 2015 in an all-stock deal valued at $5.5 billion, the firm has failed to realize the synergies it hoped the deal would bring. Per Figure 8, Dentsply Sirona’s Core Earnings fell from $477 million in 2016 to just $190 million in 2020. The firm’s Core Earnings margin fell from 13% in 2016 to 6% in 2020 while its ROIC fell from 5% to 2% over the same time.
Figure 8: Dentsply Sirona’s Revenue & Core Earnings Since 2016
Sources: New Constructs, LLC and company filings
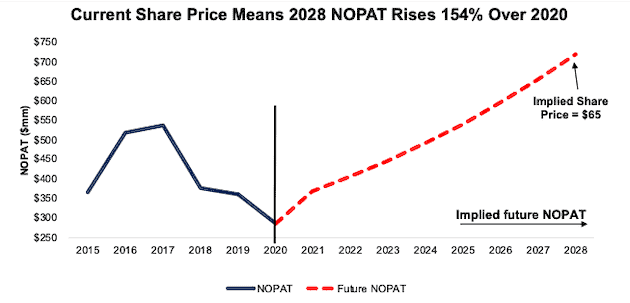
The Market Expects Dentsply Sirona’s NOPAT to Rise 154%
Below, we use our reverse DCF model to show the growth expectations baked into Dentsply Sirona’s current stock price. To justify its current price of $63/share, the firm must:
- immediately improve NOPAT margin to 8.9% (equal to 2019 vs. 8.5% in 2020) and
- grow revenue by 12% compounded annually for the next eight years, which includes 24% growth in 2021 (equal to consensus) and 10% growth each year thereafter (versus consensus estimates of 5.2% in 2022 and 4.5% in 2023).
In this scenario, Dentsply Sirona’s NOPAT grows 12% compounded annually to $719 million in 2028, or 154% above its 2020 NOPAT. See the math behind this reverse DCF scenario. Figure 9 compares Dentsply Sirona’s implied future NOPAT in this scenario with its historical NOPAT.
Figure 9: Current Price Implies Huge Reversal in NOPAT
Sources: New Constructs, LLC and company filings
44% Downside Even If Dentsply Sirona Grows at Consensus Estimates
Even if Dentsply Sirona grows at consensus revenue estimates, the stock has significant downside risk. In this scenario, we assume:
- Dentsply Sirona maintains its TTM margin of 8.5% and
- grows revenue by 11% compounded annually from 2021 to 2023 (equal to consensus estimates) and
- grows revenue by 3.5% a year from 2024-2028 (above its three-year pre-pandemic revenue CAGR of 2.5%).
In this scenario, NOPAT grows 6% compounded annually for the next eight years and the stock is worth $36/share today – a 43% downside to the current price. See the math behind this reverse DCF scenario.
This scenario could still prove optimistic given the firm’s NOPAT has fallen 19% compounded annually since 2016 (the first complete year since its merger). If the trend of profit decline continues, the stock holds even greater downside risk.
Each scenario assumes Dentsply Sirona is able to grow revenue, NOPAT, and FCF without increasing working capital or fixed assets. This assumption is unlikely but allows us to create best-case scenarios that demonstrate how high expectations embedded in the current valuation are. For reference, Dentsply Sirona’s invested capital increased by 3% since 2017.
The Importance of Sector and Holdings Based Fund Analysis
We offer clients in-depth reports for all the 7,700+ ETFs and Mutual Funds under coverage. Click below for a free copy of VALQ’s standard ETF report.
ETF investors can make better-informed decisions by combining rigorous sector/style analysis with in depth analysis of the holdings of each ETF. Simply buying a mutual fund or ETF based on past performance does not necessarily lead to outperformance. Only through holdings-based analysis can one determine if an ETF is allocating to undervalued, high-quality stocks, as VALQ does.
However, most investors don’t realize they can already get the sophisticated fundamental research[2] that enables investors to overcome inaccuracies, omissions, and biases in legacy fundamental datasets. Our Robo-Analyst technology analyzes the holdings of all ETFs and mutual funds under coverage to avoid “the danger within.” For reference, the number of holdings in these All Cap Value ETFs and mutual funds vary from just 16 stocks to 1,793 stocks in a given fund. Our diligence on holdings allows us to cut through the noise and find ETFs, like American Century STOXX U.S. Quality Value ETF, with a portfolio that suggests future performance will be strong.
This article originally published on March 22, 2021.
Disclosure: David Trainer, Kyle Guske II, and Matt Shuler receive no compensation to write about any specific stock, style, or theme.
Follow us on Twitter, Facebook, LinkedIn, and StockTwits for real-time alerts on all our research.
[1] Every quarter, we rank each sector and style from best to worst.
[2] Three independent studies from respected institutions prove the superiority of our data, models, and ratings. Learn more here.
Appendix
Figure 10 lists the 35 stocks in VALQ’s holdings that we’ve featured as Long Ideas.
Figure 10: Open Long Ideas That VALQ Holds
Sources: New Constructs, LLC


